Thinkorswim Studies - How to Set Up and Use
Stock Market Guides is not a financial advisor. Our content is strictly educational and should not be considered financial advice.
The Thinkorswim trading platform by TD Ameritrade is known for offering a lot of useful features to investors. One of those features involves being able to access a large array of studies and stock indicators that aid in the technical analysis of stocks.
Many investors like using studies because it allows them to analyze whether a given stock might be suitable to purchase.
This is a guide about Thinkorswim studies. It will show how to set them up and how to use them.
What Is Thinkorswim?
Thinkorswim is a free trading software available from Schwab.
You can use it to buy stocks and options in the stock market.
TD Ameritrade customers can download Thinkorswim from here. It's available in different versions: desktop, web, and mobile.
Each version is unique and different from each other. This guide is going to show how to set up the desktop version of Thinkorswim.
Stock Market Guides
Stock Market Guides identifies swing trading opportunities that have a historical track record of profitability in backtests.
Average Annualized Return
79.4%
What Exactly Is a Thinkorswim Study?
A "study" in Thinkorswim refers to an indicator or analytical tool that can be applied to a chart to assist with stock market analysis. Studies provide additional information or insights into the price movements and trends of a particular stock.
They can include various indicators and calculations, such as moving averages, Keltner Channels, and RSI indicators, among others.
These studies are used by active traders and investors to make informed decisions in the stock market.
What Studies Are Available in Thinkorswim?
Thinkorswim offers a wide array of studies to choose from. These studies are organized in several ways, including:
-
Based on the type of studies they are, such as momentum studies and moving average studies.
-
Based on the creator of the study, such as those created by John Carter or David Elliott.
-
Based on specific categories of studies, like candlestick patterns.
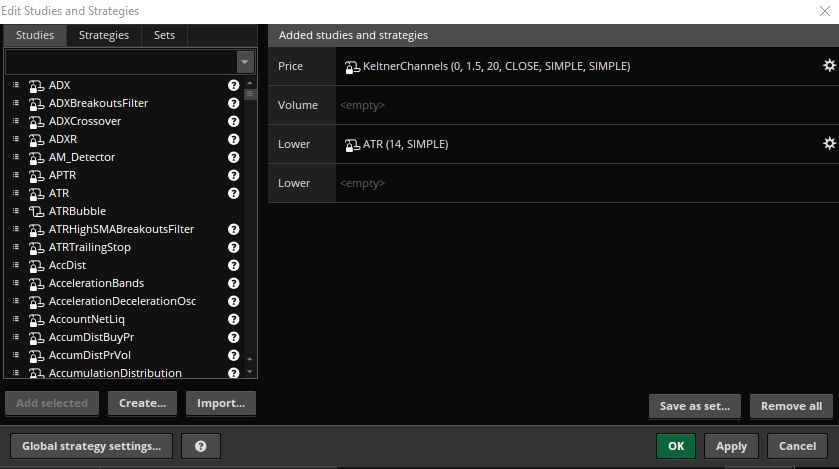
If you look at the left side of that image, it gives you an idea of just how many Thinkorswim studies there are. There are 17 listed on the screen there, and that doesn't even cover all the studies that start with the letter "A."
We've found that Thinkorswim has one of the best selections of studies available among major trading platforms. Not only is the selection good, but the ways they organize them help new investors learn about the various studies available that might interest them.
How Do You Set Up a Study in Thinkorswim?
Here are the steps to set up a study in Thinkorswim:
-
Right-click on the chart for the stock you're interested in analyzing.
-
From the right-click menu, go to "Studies."
-
Select "Add Study."
-
A list of available studies will appear, organized by type, creator, or category.
-
You can choose a study by navigating through those options or use the "All Studies" option at the very top to find a specific study alphabetically.
-
Once you find the study you want to add (for example, the Keltner Channel), select it.
-
The selected study will be added to your chart, providing additional analysis tools or indicators.
This video about Thinkorswim studies shows how to do each of those steps:
The Thinkorswim layout we used in that video was a custom one we created here at Stock Market Guides. It's available for free and you can learn how to use it in this guide about setting up Thinkorswim.
You can further customize the settings of the study, such as its parameters, color, and other options, by right-clicking on it and selecting "Edit study."
After making any desired adjustments, click "OK" to apply the study with your custom settings.
What Happens After You Set Up a Study in Thinkorswim?
After you set up a study in Thinkorswim, it becomes a part of the chart analysis for a particular stock. The study provides additional information or analysis tools related to the price movements of that stock.
Once the study is set up and applied to a chart, it will display relevant data or indicators on the chart, assisting you in making informed decisions for trading or investing in that security.
Learning More About Thinkorswim Studies
You can contact us any time if you would like to ask any questions about Thinkorswim studies or anything about trading in general.
Join Our Free Email List
Get emails from us about ways to potentially make money in the stock market.
Stock Market Guides
You can trade without an edge, but why?
What We Offer
Stock Market Guides identifies swing trading opportunities that have a historical track record of profitability in backtests.
Average Annualized Return
79.4%