What Is a Moving Average in the Stock Market?
Stock Market Guides is not a financial advisor. Our content is strictly educational and should not be considered financial advice.
Moving averages are a popular stock indicator used by many active investors in the stock market.
This article explains what a moving average is and why they can be helpful to investors. It also gives examples of what moving averages look like on stock charts.
What Exactly is a Moving Average?
Let's start with a formal definition for moving average:
Moving averages can be calculated for any period of time you want. You can use a 5-period moving average or a 500-period moving average or anything you'd like.
You can also set the period of time to be one day or one minute or any other period of time you'd like.
The moving average is typically represented by a line on a price chart that plots the value of the moving average for each time interval on the chart.
Stock Market Guides
Stock Market Guides identifies swing trading opportunities that have a historical track record of profitability in backtests.
Average Annualized Return
79.4%
Example of a Moving Average
This image depicts a moving average for Carvana stock:
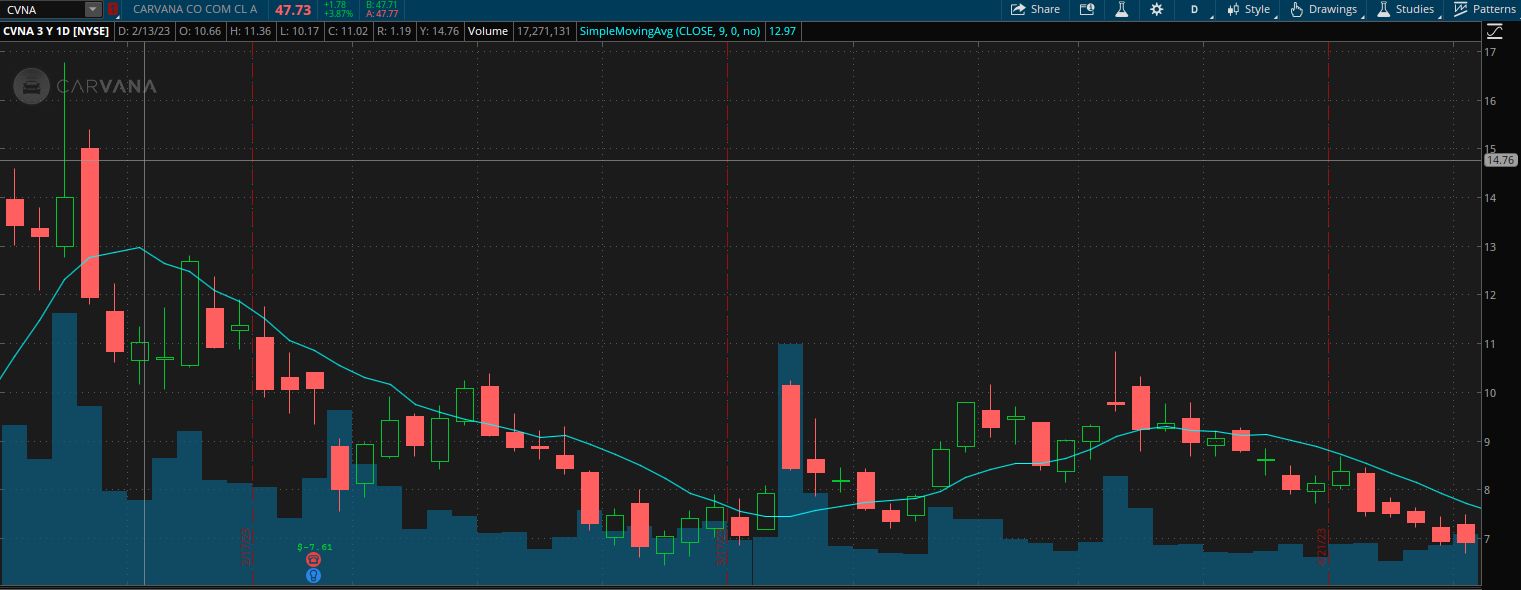
Notice the blue line on the stock chart. That is the moving average. This particular one is a 20-period moving average where each period is set to one day.
You can see that moving average fluctuates as time elapses.
How is a Moving Average Calculated?
There are different types of moving averages (more on that below). One of the most common is a simple moving average.
A simple moving average, also sometimes referred to in short as SMA, is calculated by taking the sum of the closing prices of a specific number of bars and dividing that sum by the number of bars.
Here is a formal equation:
So for example, if you want to calculate the 3-day simple moving average for a stock, and the close prices from the last 3 days were, respectively, 100.00, 101.00, and 102.00, then the value of that moving average would be:
You can tweak the settings of a simple moving average to instead use the open prices of the bars or other price points.
It's important to note that moving averages are backward-looking indicators, as they are calculated based on historical data.
Video About Moving Averages
This video we made about moving averages in stocks might help improve your understanding:
Are There Different Types of Moving Averages?
There are a number of different types of moving averages. The most popular are the simple moving average, explained above, and the exponential moving average.
The exponential moving average, also sometimes referred to as EMA for short, puts more weight on recent price bars, making it more responsive to current price changes compared to the simple moving average.
With a simple moving average, a price today can change abruptly and not have much of an immediate impact on the moving average value. With an exponential moving average, on the other hand, an abrupt change in price today has a more noticeable immediate impact on the moving average value.
How Can Investors Benefit from Moving Averages?
Moving averages can be used by traders to identify trends in a stock's price pattern. They're popular among active traders, including swing traders and day traders.
A stock is considered to be in an uptrend when the moving average line slopes upward, and it's considered to be in a downtrend when the moving average line slopes downward.
Additionally, the position of the price bars relative to the moving average line can also be analyzed. Price bars consistently above the moving average line indicate a stock in an uptrend, while bars crossing back and forth across the moving average line suggest the lack of strong trend.
It might be helpful to know whether a stock is in a trend or not. Here at Stock Market Guides, we've done a lot of research on trends. Backtests suggest that there might be profit opportunities to be had by investing in stocks that are trending upward.
We even developed our own trading strategies that use a stock's price trend as a basis for making an investment. A simple moving average is a key component of many of our strategies.
We offer a service where you can learn the strategies we use and get alerts when trade opportunities come up.
Learning More About Moving Averages
You can contact us any time if you would like to ask any questions about moving averages or about anything else related to the stock market.
Join Our Free Email List
Get emails from us about ways to potentially make money in the stock market.
Stock Market Guides
You can trade without an edge, but why?
What We Offer
Stock Market Guides identifies swing trading opportunities that have a historical track record of profitability in backtests.
Average Annualized Return
79.4%