How Keltner Channels Work in Stock Trading
Stock Market Guides is not a financial advisor. Our content is strictly educational and should not be considered financial advice.
Keltner Channels are a type of study used by active stock market traders to help them make trading decisions.
If you want to learn more about Keltner Channels and how they work, then you're in the right place. We'll take you step by step through their mechanics and share examples.
What Exactly Is a Keltner Channel?
Keltner Channels are a type of stock indicator depicted as a set of three lines on a stock chart.
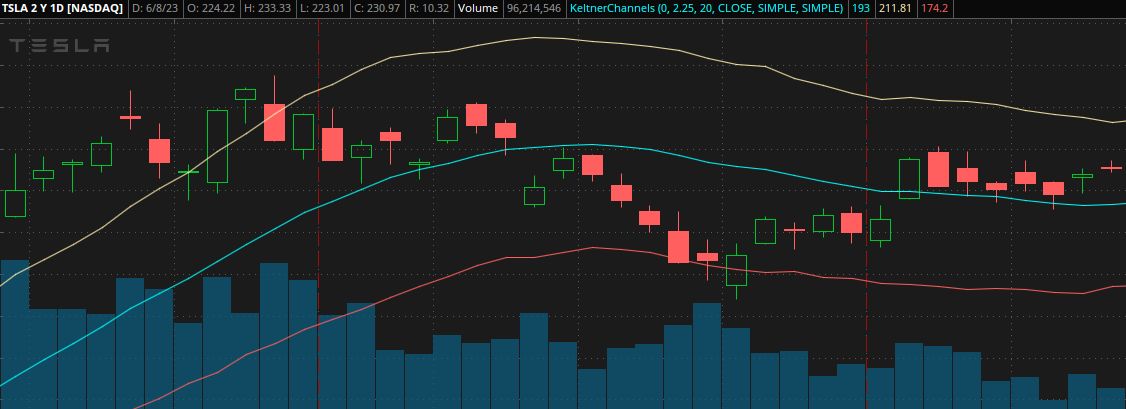
The above image is a stock chart for Tesla. You can see the Keltner Channel lines in that image: the tan line, blue line, and red line.
The middle line can be thought of as the anchor. It's a moving average line, which will be defined in more detail below.
The upper and lower lines are both set at equal distances away from the center line. The distance of those lines is based in the stock's price volatility.
Stock Market Guides
Stock Market Guides identifies swing trading opportunities that have a historical track record of profitability in backtests.
Average Annualized Return?
79.4%
Video About the Keltner Channel
This video we made about Keltner Channels might be helpful:
How Are Keltner Channel Values Calculated?
The upper and lower lines of the Keltner Channel rely on the value of the middle line. So let's start by explaining that.
The Middle Line
The middle line is a simple moving average, also sometimes referred to as SMA. The default settings for the Keltner channel are to use a 20-period simple moving average.
That moving average is calculated by taking the average closing price of the last 20 periods. Mathematically, the means adding the closing prices of all 20 periods, and then dividing that sum by 20.
If you're looking at a daily chart, then each price bar represents one day. In that case, to get the 20-period simple moving average as of any point on the chart, you would take the average closing price of the last 20 days.
You can do the same calculation on charts for other time frames, too. If you're using a 1-minute chart, then each price candle represents one minute of price activity. In that case, the 20-period simple moving average means taking the average closing price of the last 20 minutes.
The Upper and Lower Keltner Lines
The upper and lower Keltner lines are both calculated based on the value of the 20-period moving average.
By default, the upper Keltner Channel line equals the 20-period simple moving average plus 1.5 times the average true range.
The average true range, also sometimes referred to as ATR, is an indicator that takes the average of the "true range" value for the stock. The true range for any given period is simply the high minus the low.
By default, the ATR takes the average of the true range value for the last 14 periods:
So you take 1.5 times that ATR value, add it to the moving average value, and that gives you the value for the default upper Keltner Channel line (UKC).
The lower Keltner Channel line is the same, but in reverse; it equals the 20-period simple moving average minus 1.5 times the average true range
Those are the default settings, but they can be modified.
For example, for the middle line, you could use an exponential moving average instead. Or you could have your average calculated for a different number of periods.
For the upper and lower lines, you could use a different factor for the multiplying the ATR. Or for the ATR, you could have it calculated for a different number of periods.
According to our research, though, there's potentially a lot of value just in the default settings themselves. So if you feel overwhelmed about the idea of customizing Keltner Channels, rest assured that you might be able to use them without tweaking any of the default settings.
How Can You Use Keltner Channels in Trading?
For one, Keltner Channels help you identify when there's a trend. The slope of the three lines can help confirm it for you.
On the left side of that image, you can see the three lines are relatively flat. That informs us that there may not be a noticeable trend in one direction or another.
On the right side of the image, all three lines slope upward. That suggests the stock might be in an uptrend.
Another benefit of Keltner Channels is that they can give you information about how strong a trend is.
If you look at the upper Keltner line from that image, for example, you'll see that sometimes the price overlaps it. In some cases, the entire price candle is over the upper Keltner line.
That suggests the upward trend might be a strong one. In other words, you can compare the stock's price activity to the Keltner lines to understand how strong a trend might be.
Knowing about the direction of trends and the strength of trends can be valuable for traders and investors.
We've done quite a bit of research and found a number of trading strategies that are profitable in back tests and are based on 1) whether the stock is in an uptrend, and if so, 2) how strong of a trend it is.
We have an article about one Keltner Channel trading strategy in particular that we've researched and that performs favorably in back tests.
Can You Use Keltner Channels on Any Time Frame?
You can use Keltner Channels on any time frame as far as the chart goes.
If you are a swing trader, you can use it on a daily time frame or weekly time frame to help you make trading decisions.
If you are a day trader, you can use Keltner Channels on a 1-minute chart, 5-minute chart, or any other increment that suits you.
The way the Keltner Channel works would still be the same no matter which time frame you're using.
How Do You Find Stocks That Have Keltner Channel Pullbacks?
You can find them by using our Keltner Channel Pullback scanner. It's a free tool we offer here at Stock Market Guides. It uses our proprietary scanning technology to find stocks that have Keltner Channel pullbacks.
Here's how the scanner results look:
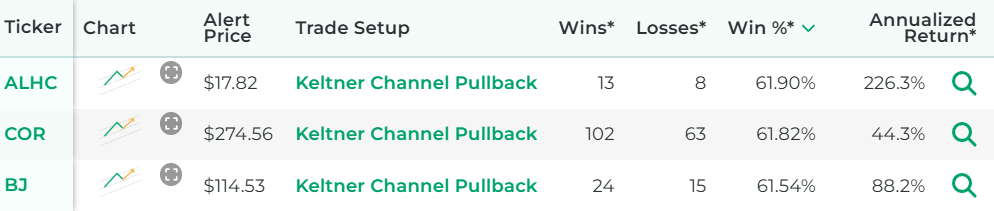
That tool ensures that you don't have to waste time flipping through stock charts manually to find stocks with a Keltner Channel pullback.
Our Research on Keltner Channel Trading Strategies
Our specialty here at Stock Market Guides is researching how trading strategies have performed historically. We've spent a lot of time researching Keltner Channels.
We did backtests and determined which Keltner Channel settings may have been most effective historically.
We also studied which stocks had the best results with using the Keltner Channel indicator.
Here is some data that shows how a proprietary Keltner Channel trading strategy we created has performed historically according to backtests:
Wins?
---
Losses?
---
Win Percentage?
---
Annualized Return?
---
Anyone who signs up for our swing trading scanner service will be able to see stocks that qualify for that trading strategy in real time.
Join Our Free Email List
Get emails from us about ways to potentially make money in the stock market.
Stock Market Guides
You can trade without an edge, but why?
What We Offer
Stock Market Guides identifies swing trading opportunities that have a historical track record of profitability in backtests.
Average Annualized Return?
79.4%