Stocks With a Keltner Channel Pullback Today
Stock Market Guides is not a financial advisor. Our content is strictly educational and should not be considered financial advice.
This is a scan for stocks that are in a pullback today as defined by how the stock price relates to the stock's Keltner Channel. You can sort columns or add filters in order to fine-tune the results below from our stock scanner.
As of June 12, 2026 at 1:14am Eastern Time
*Wins, Losses, Win Percentage, and Annualized Return are referring to how the stock performed in backtests for the Trade Setup indicated.
How to Use Our Scanner for Keltner Channel Pullback Stocks
The above list represents stocks that have Keltner Channel pullbacks today.
It's powered by our proprietary stock scanner, which searches once per day for stocks that have Keltner Channel pullbacks.
You can sort columns using the up and down arrows next to the column name. You can add filters for the column values by clicking the "Add Filter" button above the list of Keltner Channel pullback stocks. This scanner is designed for active stock traders.
This video shows how to use our scanner:
Scanner Features that Require a Subscription
Our free scanner offers you the ability to find stocks that have Keltner Channel pullbacks, but you may need more than that to ensure you're making trades that have a true edge.
Our paid Swing Trading Service includes scanner features that are designed to offer you all the intelligence our research can offer. These are the scanner features you get if you pay for a subscription:
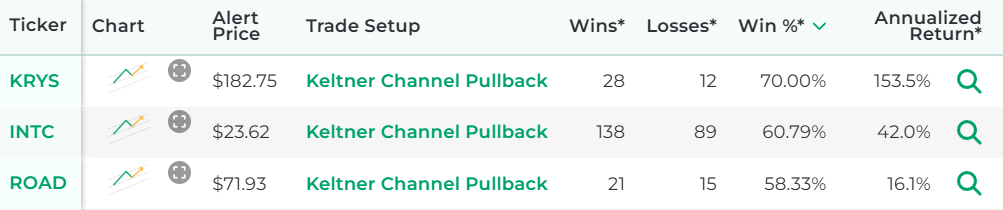
- See the historical backtested performance for each scan result. It looks like this:
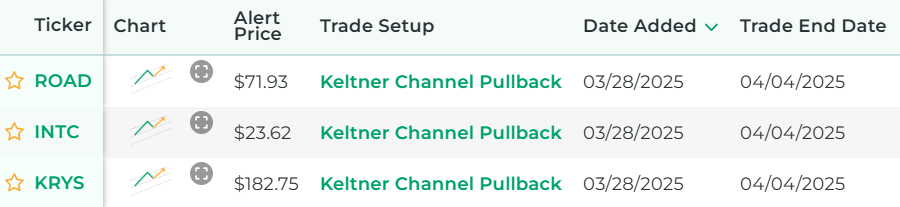
- See full trade setups for each scan result, including when to enter and exit. It looks like this:
- Get alerted when there are new scan results (by text or email).
- Get access to real-time scan updates throughout the trading day.
- Access scan results for all trading strategies in a single scan to easily see which trade setups have the best backtested performance across the entire market at any given time.
- Get access to scan results for our proprietary trading strategies, which required years of research to develop.
- Find Stock Trade Setups That Have a Backtested Edge
- Has DIY Swing Trading Scanner
- Get Swing Trade Picks from Our Scanner: 79.4% Average Annualized Return in Backtests
Here's a video that explains the difference between our free Keltner Channel pullback scanner and the scanner from our paid service:
Stock Market Guides
Stock Market Guides identifies swing trading opportunities that have a historical track record of profitability in backtests.
Average Annualized Return
79.4%
What Exactly Is a Keltner Channel?
A Keltner Channel is a type of stock indicator that's depicted as a set of three lines on a stock chart.
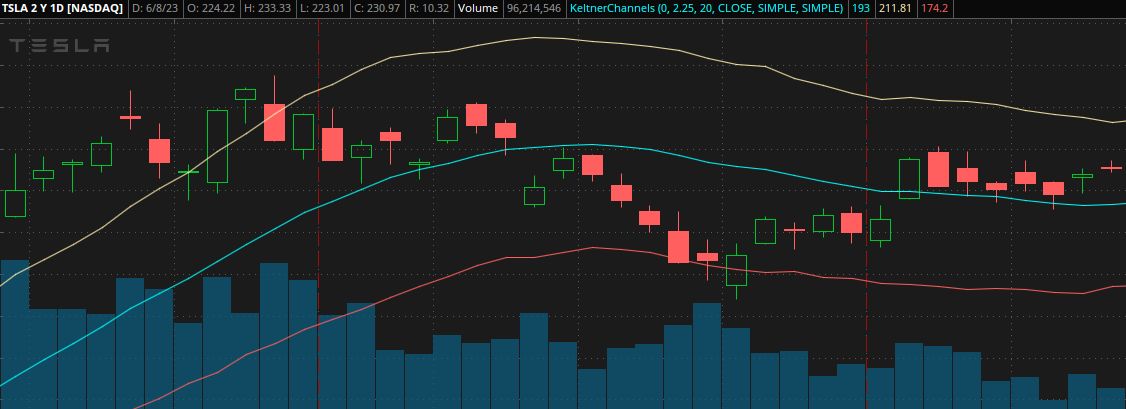
The above image is a stock chart for Tesla. You can see the Keltner Channel lines in that image: the tan line, blue line, and red line.
The middle line can be thought of as the anchor. It's a moving average line, which will be defined in more detail below.
The upper and lower lines are both set at equal distances away from the center line. The distance of those lines is based in the stock's price volatility.
Video About the Keltner Channel
This video we made about Keltner Channels might be helpful:
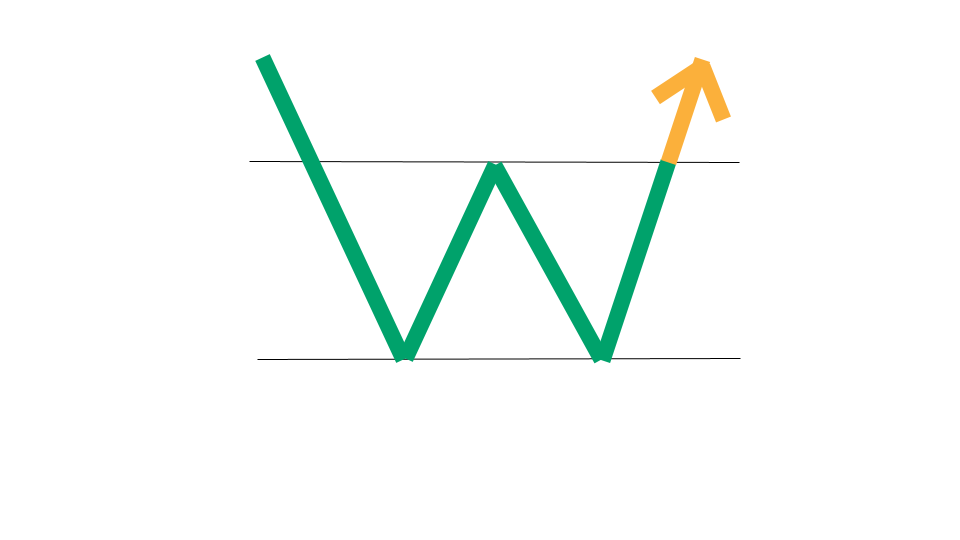
What Exactly Is a Pullback?
A pullback in stocks refers to price activity that occurs during an uptrend in the stock market.
It happens when a stock's price is trending upward, but temporarily slows down and comes down before potentially continuing its uptrend.
In simpler terms, a pullback is a short-term dip or decline in the price of a stock that is otherwise in an upward trend.
Video About Pullbacks
This video we made about Pullbacks might be helpful:
How We Find Keltner Channel Pullback Stocks Each Day
Our one-of-a-kind scanning technology is at the heart of everything we do here. We have a way to program a trading strategy into our scanner, and then it uses real-time data feeds to find any stocks that meet the criteria of the trading strategy.
In the case of finding stocks that have Keltner Channel pullbacks each day, our scanner looks for stocks that just exhibited a Keltner Channel pullback on the most recent trading day.
Our Criteria for Defining Keltner Channel Pullback Stocks
To find stocks that have Keltner Channel pullbacks, our scanner looks for stocks that surged above the upper Keltner Channel and then came back to the middle line of the Keltner Channel.
Other Popular Scans at Stock Market Guides
Want to see scans we have for other popular indicators, chart patterns, and candlestick patterns? Check them out here:

Have Questions About Keltner Channel Pullback Stocks or Our Services?
If you have questions about stocks with Keltner Channel pullbacks or questions about any services we offer, you can contact us any time and we'll be ready to help.
Join Our Free Email List
Get emails from us about ways to potentially make money in the stock market.
Stock Market Guides
You can trade without an edge, but why?
What We Offer
Stock Market Guides identifies swing trading opportunities that have a historical track record of profitability in backtests.
Average Annualized Return
79.4%