Thinkorswim Charts - How to Set Up and Use
Stock Market Guides is not a financial advisor. Our content is strictly educational and should not be considered financial advice.
The Thinkorswim trading platform by TD Ameritrade is known for offering a lot of useful features to investors. One of those features is their stock charts.
For many investors, stock charts are the foundation of their investment decisions. They not only show the price history for any given stock, but they also include features like studies and indicators.
This is a guide about Thinkorswim charts. It will show how to set them up and how to use them.
What Is Thinkorswim?
Thinkorswim is a free trading software available from Schwab.
You can use it to buy stocks and options in the stock market.
TD Ameritrade customers can download Thinkorswim from here. It's available in different versions: desktop, web, and mobile.
Each version is unique and different from each other. This guide is going to show how to set up the desktop version of Thinkorswim.
Stock Market Guides
Stock Market Guides identifies stock investing opportunities that have a historical track record of profitability in backtests.
Average Annualized Return?
43.1%
How Do You Access Thinkorswim Charts?
To access charts from the desktop version of Thinkorswim, click on the Charts tab, and then make sure the Charts sub-tab is selected. That gets the stock chart on your screen.
From there, you can input the stock's ticker symbol at the top left of the chart. This allows you to see the price chart for any stock you want.
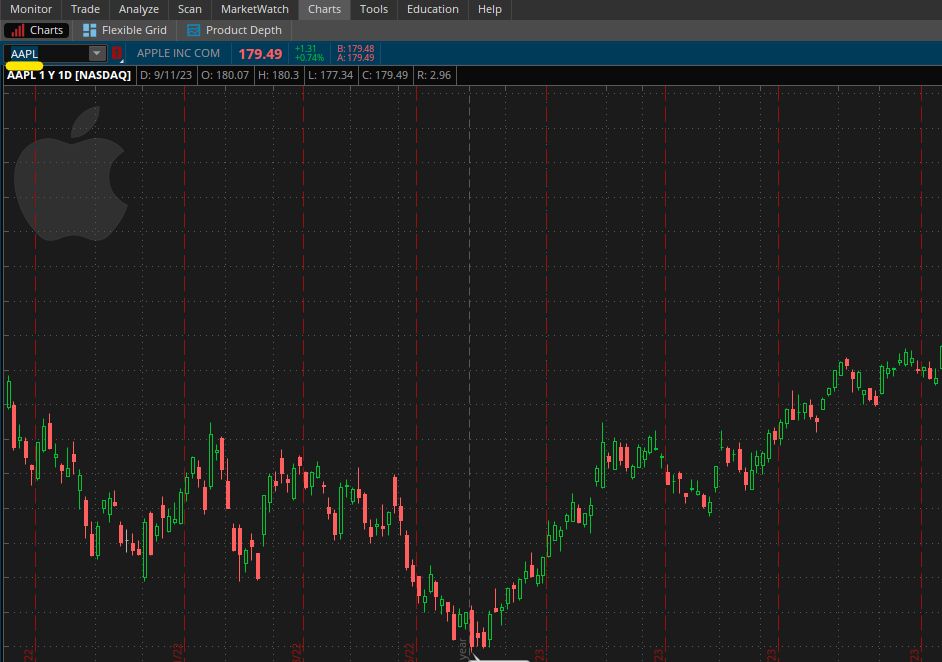
In the image above, there is a yellow line under the box where you can input the ticker symbol.
Key Features of Thinkorswim Charts
Here are some of the features and functionalities of Thinkorswim charts:
Studies
You can add various studies to the charts. These range from stock indicators like RSI and moving averages to studies like Keltner Channels. Thinkorswim is known for having a great selection of indicators available to use with their charts.
Time Frames
You can control the time frame of the chart. You can specify how much time each bar on the chart represents (for example, one day or one minute). This accommodates both swing traders and day traders. You can also specify how far back in time the chart should go (for example, maybe you want to see a 5-year history for the stock).
Alerts
You can set price alerts. For example, you can set an alert to notify you if the price of a stock goes above or below a certain level.
Price Candle Information
The charts display various data points for each price candle such as the time, open, high, low, close, and volume. These values change as you move your mouse over different price bars on the chart. And of course by seeing a visual representation of the price candles, you can visually identify chart patterns.
Drawings
You can draw trendlines or make other annotations on the chart.
Earnings and Dividend Dates
The charts provide information about earnings and dividend dates, which can be important for trading decisions. There are small icons at the bottom of the chart to indicate these dates. A green icon is used for ex-dividend dates and a blue or red icon is used for earnings announcements.
You can see those icons in this image:
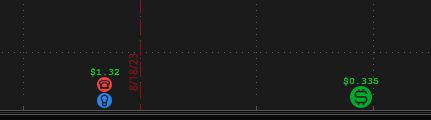
Chart Styles
You can change the chart style, such as switching from candlestick charts to line charts or bar charts.
This video about Thinkorswim charts shows how each of those features works:
The Thinkorswim layout we used in that video was a custom one we created here at Stock Market Guides. It's available for free and you can learn how to use it in this guide about setting up Thinkorswim.
How Do You Zoom In or Out on Thinkorswim Charts
You can zoom the chart in or out in Thinkorswim as follows:
To zoom in a Thinkorswim chart, move your mouse over the bottom of the chart where it shows dates or times, left click, and drag to the left. Another way to zoom in is to click the small magnifying glass at the bottom right that has a plus sign in it.
To zoom out a Thinkorswim chart, move your mouse over the bottom of the chart where it shows dates or times, left click, and drag to the right. Another way to zoom out is to click the small magnifying glass at the bottom right that has a minus sign in it.

That image shows what it looks like at the bottom of the chart where the dates or times are. When you mouse over it, you'll notice your cursor changes and looks like a left-and-right arrow. That's how you know you can left click it and drag it in either direction.
How Do You Scroll on Thinkorswim Charts
You can scroll a Thinkorswim chart by using the scroll wheel on your mouse while your cursor is hovering over the chart. Roll the scroll wheel up to scroll the chart to the left. Roll the scroll wheel down to scroll the chart to the right.
You can also use the scroll bar at the bottom of the chart to scroll the chart left and right.
How Do You Modify Thinkorswim Charts
You can modify Thinkorswim charts in several ways:
-
Adding Indicators: To add indicators to the chart, you can right-click on the chart itself, go to "Studies," and then choose "Add a study." A submenu with various study indicator options will appear, and you can select the indicators you want to add to the chart.
-
Edit Indicators: To edit existing indicators on the chart, you can right-click on the chart, go to "Studies," and select "Edit studies." This allows you to customize and adjust the parameters of the indicators and studies that are already enabled on the chart.
-
Buy or Sell Stocks: You can buy or sell stocks directly from the Thinkorswim chart. Right-click on the chart, then select Buy or Sell, which will open an ordering window.
-
Set Alerts: To set price alerts, right-click on the chart, go to "Alert," and then configure your alert criteria, including the price level at which you want to be alerted.
-
Change Chart Style: To change the chart style (e.g., from candlestick to line or bar chart), right click the chart and select "Style" from the menu. Then select your preferred chart style.
-
Drawings: If you want to draw trendlines or other markings on the chart, you can do so by using the drawing tools. Right click the chart, then select Drawing. Then choose from one of the drawing features that are displayed.
-
Time Frame Customization: To change the time frame for the chart, click the icon at the top of the chart to the right of the gear icon. In the image below, it's represented by the letter D and is right above the yellow line.
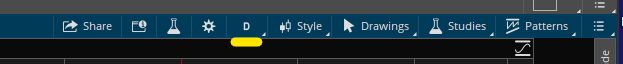
This allows you to edit both the amount of time each price candle represents as well as how far back in time the chart goes.
Learning More About Thinkorswim Charts
You can contact us any time if you would like to ask any questions about Thinkorswim charts, or about anything related to trading in general.
Join Our Free Email List
Get emails from us about ways to potentially make money in the stock market.
Stock Market Guides
You can trade without an edge, but why?
What We Offer
Stock Market Guides identifies stock investing opportunities that have a historical track record of profitability in backtests.
Average Annualized Return?
43.1%