Moving Average Crossover Strategy for the Stock Market
Stock Market Guides is not a financial advisor. Our content is strictly educational and should not be considered financial advice.
Moving average crossovers in the stock market can be the basis for a variety of trading strategies among active investors.
If you are looking to learn a moving average crossover strategy or want to understand more about moving average crossovers in general, then you're in the right place.
This article will offer a complete moving average crossover trading strategy that can be used by active traders. First, let's go over how moving average crossovers work.
What Exactly is a Moving Average Crossover?
A moving average crossover is a type of stock indicator used in stock market trading.
It involves plotting two different moving averages on a price chart. Here is the formal definition of a moving average crossover:
Typically one of the moving average lines measures a shorter duration than the other. For example, one moving average line might be a 10-period moving average, and the other one might be a 20-period moving average.
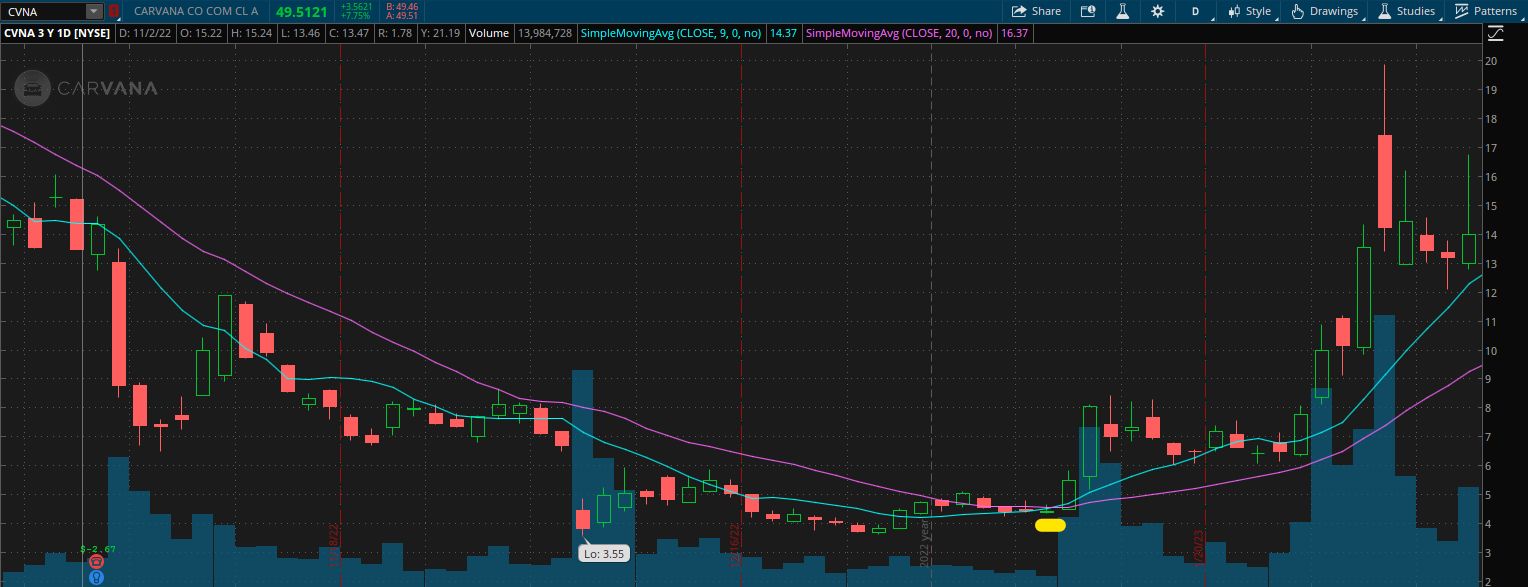
That is a picture of a stock chart for Carvana stock.
That image shows an example of a moving average crossover on a stock chart for Carvana. The blue line is a 9-period simple moving average, and the pink line is a 20-period simple moving average.
You can see where the pink line crosses over over the blue line in the middle of the chart.
Stock Market Guides
Stock Market Guides identifies swing trading opportunities that have a historical track record of profitability in backtests.
Average Annualized Return?
79.4%
Example of a Moving Average Crossover Strategy You Can Use
For this particular moving average crossover strategy, we're going to use a daily chart. That means it would be a swing trading strategy.
We're also going to use simple moving average lines that are set to 9 days and 20 days, respectively.
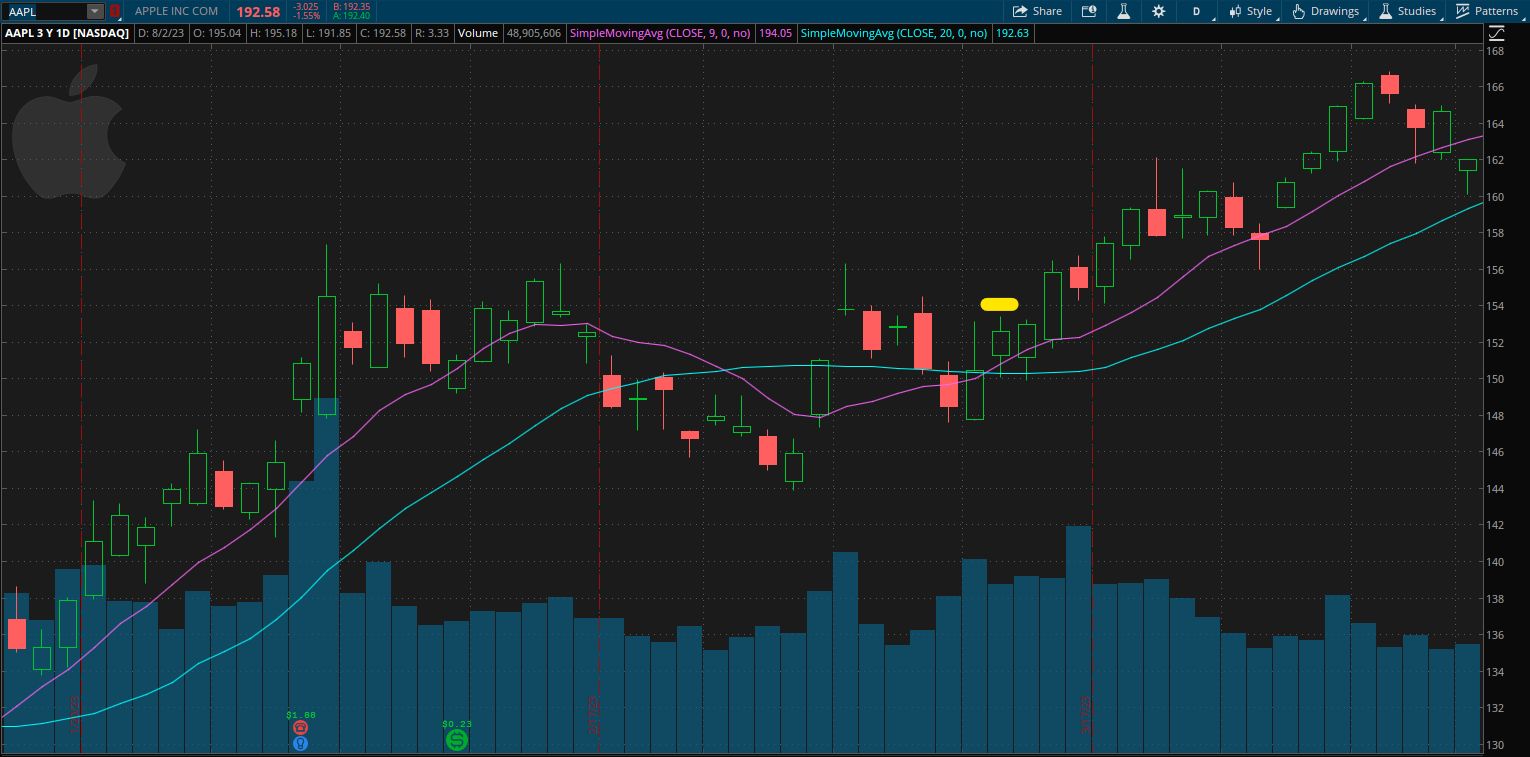
That image shows a stock chart for Apple. The blue line on the chart represents the 20-day Simple Moving Average. The pink line represents the 9-day Simple Moving Average.
Entry for the Moving Average Crossover Strategy
The entry criteria for our moving average crossover strategy is very simple. If the pink line is below the blue line, and then one day it crosses over the blue line, then we buy the next day at the opening bell.
You can see in the image above that at the yellow mark, the 9-day moving average crossover over the 20-day moving average.
The yellow mark therefore represents the entry signal for this trading strategy.
If an investor had bought the stock using the trading strategy's entry criteria, you can see that he or she might have profited since the stock price generally moved up thereafter.
You can also buy options to carry out this trading strategy. For the purpose of this article, we will use stocks as the basis for defining the rules of the strategy.
Exit for the Moving Average Crossover Strategy
There are a lot of possibilities here for the exit.
For any given trading strategy, it can be helpful to define three different criteria for the exit: profit target, stop loss, and time limit.
Not everyone uses all three, and that's totally fine. Ultimately you can set these values however you want. But for the purposes of this strategy, we will define all three:
Profit Target
We will set the profit target at 20% higher than the entry price.
The entry price was $151.19 in this example, so the profit target was set as follows:
20% of 151.19 = .2 * 151.19 = $30.54
$151.19 + $30.24 = $181.43
Our profit target will therefore be $181.43 and we can set up a sell limit order at that price.
Stop Loss
We will set the stop loss at 20% lower than the entry price.
The entry price was $151.19 in this example, so the stop loss was set as follows:
20% of 151.19 = .2 * 151.19 = $30.54
$151.19 - $30.54 = $120.65
Our stop loss will therefore be $120.65 and we can set up a stop order at that price.
Time Limit
We will set the time limit as two weeks since this is a swing trade. If the stock has not hit either the profit target or stop loss by the time limit, then we will close the trade manually at the opening bell fourteen calendar days after entry.
This video offers more information about the moving average crossover strategy we're describing:
Performance of This Moving Average Crossover Strategy
If we apply this moving average crossover strategy to the Apple example above, the results would be as follows:
The entry price shows as being $151.19.
Within two weeks of the entry, the price did not reach the profit target or the stop loss. Therefore it would have been manually closed when it reached the time limit.
The price at the opening bell after two weeks was 159.37. That means this trade might have made a profit of $8.18 per share.
This Moving Average Crossover Strategy Doesn't Always Win
The example above shows a case where this strategy might have generated a profit.
But that's just one example, and it's not enough to say with certainty that this moving average crossover strategy would be profitable for you in the long run.
There are plenty of examples of this strategy losing as well, and ultimately the only way to be sure that any given trading strategy has a track record of success is to look at how it's performed in the past.
How Do You Find Stocks That Have Moving Average Crossovers?
You can find them by using our Moving Average Crossover scanner. It's a free tool we offer here at Stock Market Guides. It uses our proprietary scanning technology to find stocks that have moving average crossovers.
Here's how the scanner results look:
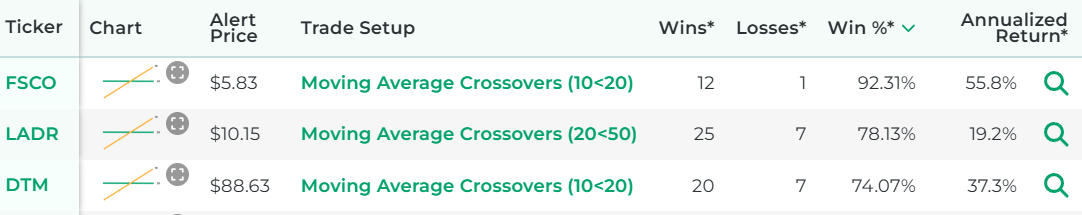
That tool ensures that you don't have to waste time flipping through stock charts manually to find stocks with a moving average crossover.
Our Research on Moving Average Crossover Strategies
Our specialty here at Stock Market Guides is researching how trading strategies have performed historically. We've spent a lot of time researching moving average crossovers in particular.
We did backtests and determined which moving average crossover settings may have been most profitable historically.
We also studied which stocks responded best to moving average crossover trade opportunities.
Here is some data that shows how a proprietary moving average crossover trading strategy we created has performed historically according to backtests:
Wins?
---
Losses?
---
Win Percentage?
---
Annualized Return?
---
Anyone who signs up for our swing trading scanner service will be able to see stocks that qualify for that trading strategy in real time.
Learning More About Moving Average Crossovers
You can contact us any time if you would like to ask any questions about moving average crossovers or about trading in general.
Join Our Free Email List
Get emails from us about ways to potentially make money in the stock market.
Stock Market Guides
You can trade without an edge, but why?
What We Offer
Stock Market Guides identifies swing trading opportunities that have a historical track record of profitability in backtests.
Average Annualized Return?
79.4%