What Is a Moving Average Crossover?
Stock Market Guides is not a financial advisor. Our content is strictly educational and should not be considered financial advice.
For those who actively invest in the stock market, it's not uncommon to hear people mention moving average crossovers.
It refers to an indicator that is often found on stock charts in most trading platforms.
This article explains what a moving average crossover is, gives an example of one, and talks about how investors might benefit from it.
What Exactly is a Moving Average Crossover?
A moving average crossover is a type of stock indicator used in stock market trading.
Here is the formal definition of a moving average crossover:
Typically one of the moving average lines measures a shorter duration than the other. For example, one moving average line might be a 10-period moving average, and the other one might be a 20-period moving average.
It doesn't matter what type of moving average lines they are. They can be simple moving average lines or exponential moving average lines.
It also doesn't matter what time frame your stock chart is set to. A moving average crossover can occur on charts where the price candles are set to one minute, one day, or anything else you prefer.
Stock Market Guides
Stock Market Guides identifies swing trading opportunities that have a historical track record of profitability in backtests.
Average Annualized Return
79.4%
Example of a Moving Average Crossover
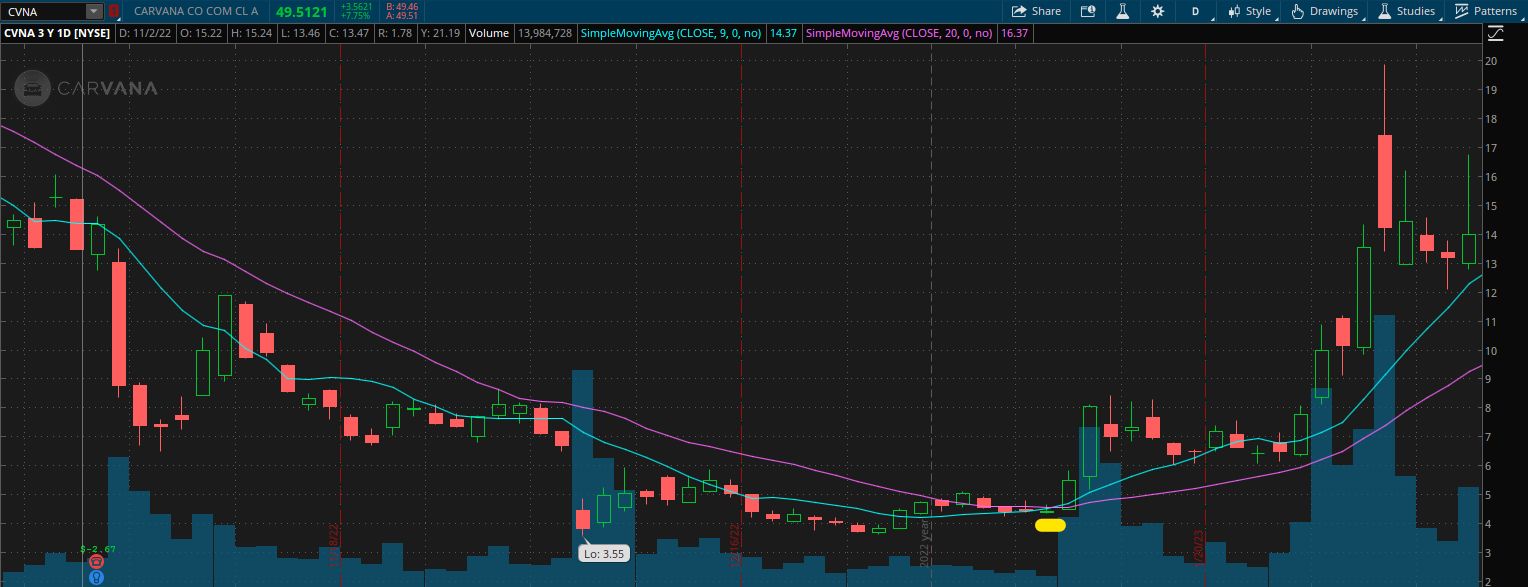
That is a picture of a stock chart for Carvana stock.
You can see two moving average lines on that chart. One is a blue line, which is set as a 9-period moving average. The other is a pink line, set as a 20-period moving average.
The 9-period average is the shorter of the two, which means it will be more responsive to recent price changes.
In that image, notice the yellow mark. That is an indication of where the two moving average lines intersect. The blue line crosses over the pink line at that point. That is an example of a moving average crossover.
Video About Moving Average Crossovers
This video we made about moving average crossovers in stocks might help improve your understanding:
How Can Investors Benefit from Moving Average Crossovers?
When the shorter moving average crosses above the longer moving average, it is considered by many to be a bullish signal, indicating the possibility of a forthcoming upward trend in the stock price. This is a common line of thinking among swing traders.
Conversely, when the shorter moving average crosses below the longer moving average, many consider it a bearish signal, indicating the possibility of a forthcoming downward trend in the stock price.
If those signals are accurate, they could offer the basis for a trading strategy since you could make a trade that corresponds with the signal.
If you look again at the image of Carvana stock above, you can see that the price of the stock had a pronounced upward move after the shorter moving average crossed over the longer one. If you had made a trade based on that signal, either by buying stock or buying a call option, you might have ended up with a profitable trade.
We put together a specific moving average crossover strategy that offers precise rules for entry and exit.
Although this trade may have turned out well, they certainly don't always turn out that way.
Here at Stock Market Guides, we've done on our own research on moving average crossovers, and our backtests suggest that conventional wisdom on that topic may not always be accurate. We have a service where we alert trade setups that have a backtested edge.
Regardless of whether a moving average crossover could be used for a trading strategy, moving average crossovers can serve as a possible indication of changes in a stock's trend.
Moving average crossovers are not a guaranteed or foolproof signal for predicting stock price movements. There is nothing in the stock market that can be predicted with completely certainty.
How Do You Find Stocks That Have Moving Average Crossovers?
You can find them by using our Moving Average Crossover scanner. It's a free tool we offer here at Stock Market Guides. It uses our proprietary scanning technology to find stocks that have moving average crossovers.
Here's how the scanner results look:
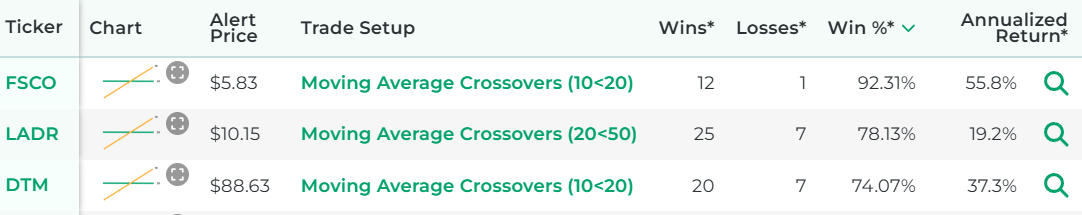
That tool ensures that you don't have to waste time flipping through stock charts manually to find stocks with a moving average crossover.
Our Research on Moving Average Crossover Strategies
Our specialty here at Stock Market Guides is researching how trading strategies have performed historically. We've spent a lot of time researching moving average crossovers in particular.
We did backtests and determined which moving average crossover settings may have been most profitable historically.
We also studied which stocks responded best to moving average crossover trade opportunities.
Here is some data that shows how a proprietary moving average crossover trading strategy we created has performed historically according to backtests:
Wins
---
Losses
---
Win Percentage
---
Annualized Return
---
Anyone who signs up for our swing trading scanner service will be able to see stocks that qualify for that trading strategy in real time.
Learning More About Moving Average Crossovers
You can contact us any time if you would like to ask any questions about moving average crossovers or about anything else related to the stock market.
Join Our Free Email List
Get emails from us about ways to potentially make money in the stock market.
Stock Market Guides
You can trade without an edge, but why?
What We Offer
Stock Market Guides identifies swing trading opportunities that have a historical track record of profitability in backtests.
Average Annualized Return
79.4%