S&P Global Inc
Stock Chart, Company Information, and Scan Results
Stock Market Guides is not a financial advisor. Our content is strictly educational and should not be considered financial advice.
S&P Global Inc Company Information, Fundamentals, and Technical Indicators
S&P Global Inc., together with its subsidiaries, provides credit ratings, benchmarks, analytics, and workflow solutions in the global capital, commodity, and automotive markets. It operates through five segments: S&P Global Market Intelligence, S&P Global Ratings, S&P Global Commodity Insights, S&P Global Mobility, and S&P Dow Jones Indices. The S&P Global Market Intelligence segment provides multi-asset-class data and analytics integrated with purpose-built workflow solutions. This segment offers Desktop, a product suite that provides data, analytics, and third-party research for global finance and corporate professionals; data and advisory solutions for research, reference data, market data, derived analytics, and valuation services; enterprise solutions, such as software and workflow solutions; and credit and risk solutions for selling ratings' credit ratings and related data and research, analytics, and financial risk solutions. The S&P Global Ratings segment operates as an independent provider of credit ratings, research, and analytics offering investors and other market participants information, ratings, and benchmarks. The S&P Global Commodity Insights segment provides information and benchmark prices for the commodity and energy markets. The S&P Global Mobility segment offers solutions serving the full automotive value chain, including vehicle manufacturers (original equipment manufacturers), automotive suppliers, mobility service providers, retailers, consumers, and finance and insurance companies. The S&P Dow Jones Indices segment operates as an index provider that maintains various valuation and index benchmarks for investment advisors, wealth managers, and institutional investors. It has operations in the United States, European region, Asia, and internationally. S&P Global Inc. was founded in 1860 and is headquartered in New York, New York.
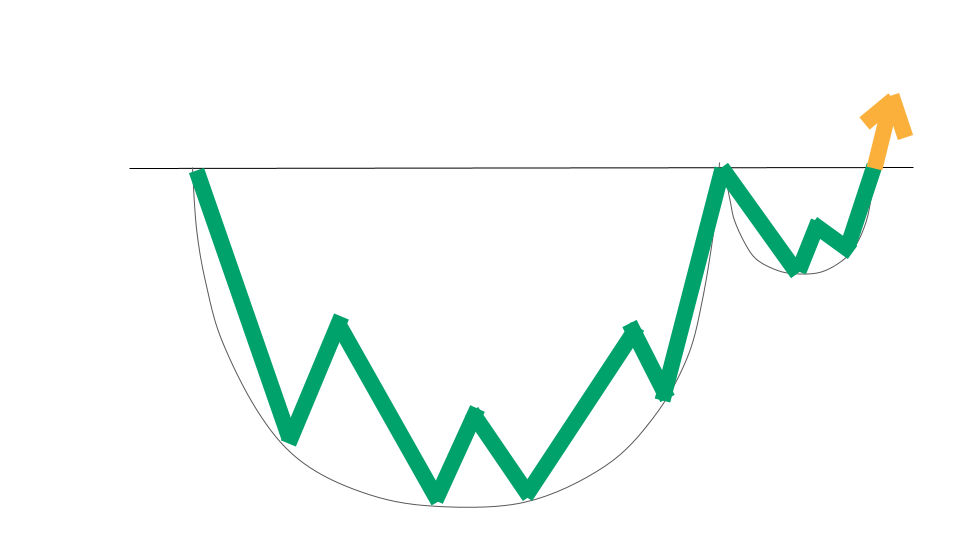
S&P Global Inc In Our Stock Scanner
As of Nov 12, 2025

Join Our Free Email List
Get emails from us about ways to potentially make money in the stock market.