PepsiCo Inc
Stock Chart, Company Information, and Scan Results
$138.68(as of Jun 29, 4:00 PM EST)
Stock Market Guides is not a financial advisor. Our content is strictly educational and should not be considered financial advice.
PepsiCo Inc Company Information, Fundamentals, and Technical Indicators
Stock Price$138.68
Ticker SymbolPEP
ExchangeNasdaq
SectorConsumer Defensive
IndustryBeverages - Non-Alcoholic
Employees306,000
CountyUSA
Market Cap$193,271.8M
EBIDTA18,696.0M
10-Day Moving Average142.06
P/E Ratio21.74
20-Day Moving Average142.03
Forward P/E Ratio16.45
50-Day Moving Average147.32
Earnings per Share6.38
200-Day Moving Average147.46
Profit Margin12.02%
RSI38.15
Shares Outstanding1,366.8M
ATR3.07
52-Week High168.19
Volume9,426,395
52-Week Low127.43
Book Value21,536.0M
P/B Ratio8.83
Upper Keltner148.95
P/S Ratio1.99
Lower Keltner135.11
Debt-to-Equity Ratio148.95
Next Earnings Date07/09/2026
Cash Surplus-24,002.0M
Next Ex-Dividend DateUnknown
PepsiCo is the largest food company in America and the second largest in the world. The iconic soft drink is available (and popular) almost everywhere. Their products are consumed more than one billion times per day and include more than just soda. PEP’s portfolio includes food brands like Frito-Lay, Cheetos, Gatorade, Doritos, and more.
PepsiCo Inc In Our Stock Scanner
As of Jun 30, 2026
Scan Name: Increasing Profit MarginScan Type: Stock Fundamentals
As of ---

Scan Name: Low PS RatioScan Type: Stock Fundamentals
As of ---
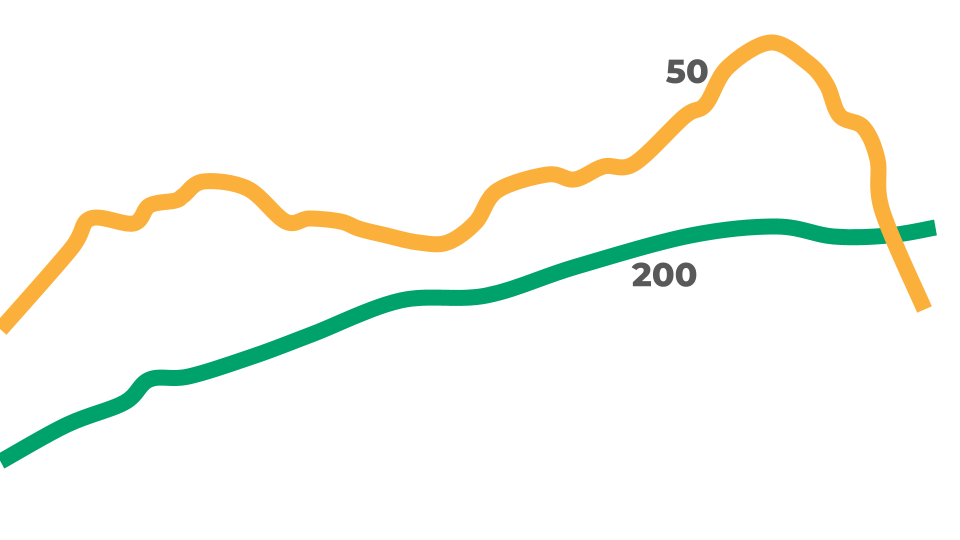
Scan Name: Death CrossScan Type: Stock Indicator Scans
As of ---

Scan Name: Increasing Book ValueScan Type: Stock Fundamentals
As of ---
Join Our Free Email List
Get emails from us about ways to potentially make money in the stock market.