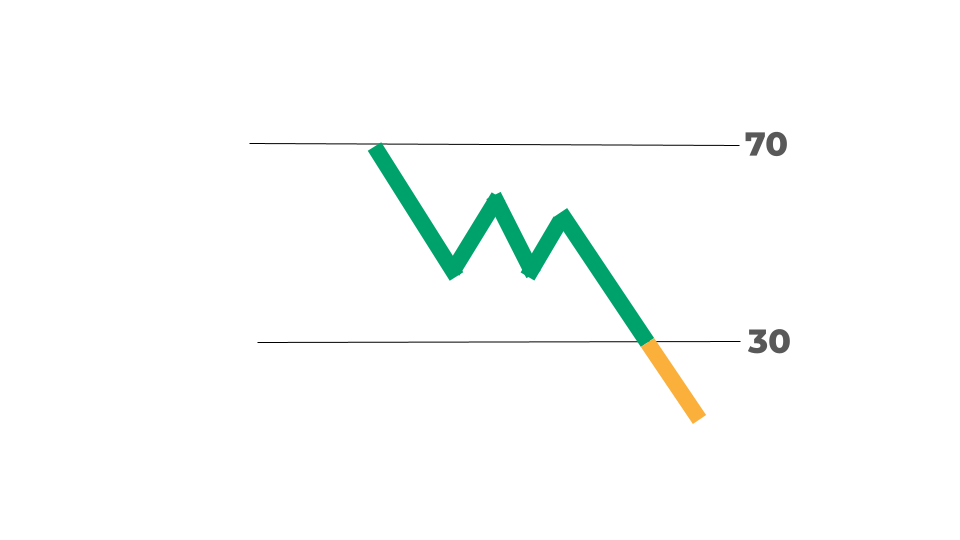
Harley-Davidson Inc
Stock Chart, Company Information, and Scan Results
Stock Market Guides is not a financial advisor. Our content is strictly educational and should not be considered financial advice.
Harley-Davidson Inc Company Information, Fundamentals, and Technical Indicators
Harley-Davidson, Inc. manufactures and sells motorcycles in the United States and internationally. The company operates in three segments: Harley-Davidson Motor Company, LiveWire, and Harley-Davidson Financial Services. The Harley-Davidson Motor Company segment designs, manufactures, and sells motorcycles, including cruiser, trike, touring, standard, sportbike, adventure, and dual sport, as well as motorcycle parts, accessories, and apparel, as well as licenses its trademarks and related services. This segment sells its products to retail customers through a network of independent dealers, as well as e-commerce channels. The LiveWire segment sells electric motorcycles, balance bikes for kids, parts and accessories, apparel, and related parts and services. The Harley-Davidson Financial Services segment provides wholesale financing services, such as floorplan and open account financing of motorcycles, and parts and accessories; and retail financing services, such as installment lending for the purchase of new and used Harley-Davidson motorcycles, as well as point-of-sale insurance and voluntary protection products. This segment also licenses third-party financial institutions that issue credit cards bearing the Harley-Davidson brand. Harley-Davidson, Inc. was founded in 1903 and is based in Milwaukee, Wisconsin.
Harley-Davidson Inc In Our Stock Scanner
As of Jan 06, 2026


Join Our Free Email List
Get emails from us about ways to potentially make money in the stock market.