Fermi Inc.
Stock Chart, Company Information, and Scan Results
$4.80(as of Apr 8, 4:00 PM EST)
Stock Market Guides is not a financial advisor. Our content is strictly educational and should not be considered financial advice.
Fermi Inc. Company Information, Fundamentals, and Technical Indicators
Stock Price$4.80
Ticker SymbolFRMI
ExchangeNasdaq
SectorReal Estate
IndustryREIT - Specialty
Employees35
CountyUSA
Market Cap$3,111.4M
EBIDTAUnknown
P/E Ratio-6.06
Forward P/E Ratio0.00
Earnings per Share-1.09
Profit Margin-Infinity%
RSI29.08
Shares Outstanding629.8M
ATR0.71
52-Week High36.99
Volume16,967,773
52-Week Low4.63
Book Value112.8M
P/B Ratio26.12
Upper Keltner8.27
P/S RatioInfinity
Lower Keltner5.09
Next Earnings DateUnknown
Cash Surplus232.0M
Next Ex-Dividend DateUnknown
Fermi Inc. engages in the development of private power campus for AI-centric customers in the United States. The company also develops, owns, and leases grid-independent energy generation and high-performance computing campuses; develops and operates integrated power generation and computing infrastructure. It also engages in acquisition of land, permitting, construction, and long-term leases. The company was founded in 2025 and is headquartered in Amarillo, Texas.
Fermi Inc. In Our Stock Scanner
As of Apr 09, 2026
Scan Name: Cash SurplusScan Type: Stock Fundamentals
As of ---

Scan Name: Heikin Ashi BreakoutScan Type: Candlestick Pattern Scans
As of ---
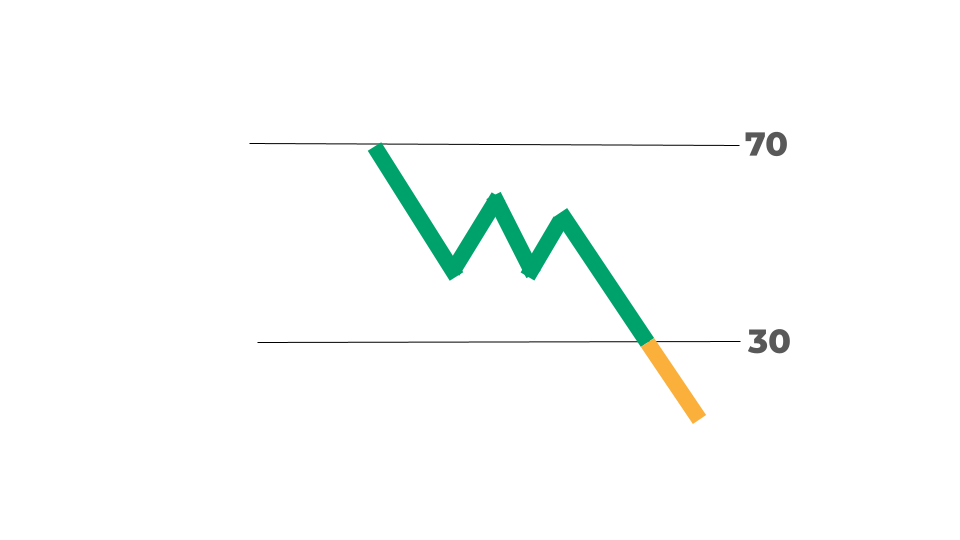
Scan Name: Oversold Stocks Scan Type: Stock Indicator Scans
As of ---

Scan Name: Low Debt to Equity RatioScan Type: Stock Fundamentals
As of ---
Join Our Free Email List
Get emails from us about ways to potentially make money in the stock market.