Best Buy Co. Inc
Stock Chart, Company Information, and Scan Results
$79.99(as of Jul 9, 4:00 PM EST)
Stock Market Guides is not a financial advisor. Our content is strictly educational and should not be considered financial advice.
Best Buy Co. Inc Company Information, Fundamentals, and Technical Indicators
Stock Price$79.99
Ticker SymbolBBY
ExchangeNyse
SectorConsumer Cyclical
IndustrySpecialty Retail
Employees82,000
CountyUSA
Market Cap$16,454.6M
EBIDTA2,618.0M
P/E Ratio14.79
Forward P/E Ratio11.90
Earnings per Share5.40
Profit Margin3.09%
RSI66.16
Shares Outstanding210.8M
ATR2.43
52-Week High81.54
Volume3,396,941
52-Week Low54.38
Book Value3,083.0M
P/B Ratio5.48
Upper Keltner82.12
P/S Ratio0.40
Lower Keltner71.18
Debt-to-Equity Ratio82.12
Next Earnings Date08/26/2026
Cash Surplus-6,048.0M
Next Ex-Dividend DateUnknown
This retail giant is one of America's leading consumer electronic stores offering everything from Apple computers to GE washing machines. As a one-stop shop for all electronics needs, the company also offers credit and repair services for its clientele. Best Buy has cemented its position as the go-to retailer for tech-savvy shoppers.
Best Buy Co. Inc In Our Stock Scanner
As of Jul 10, 2026
Scan Name: Low PS RatioScan Type: Stock Fundamentals
As of ---
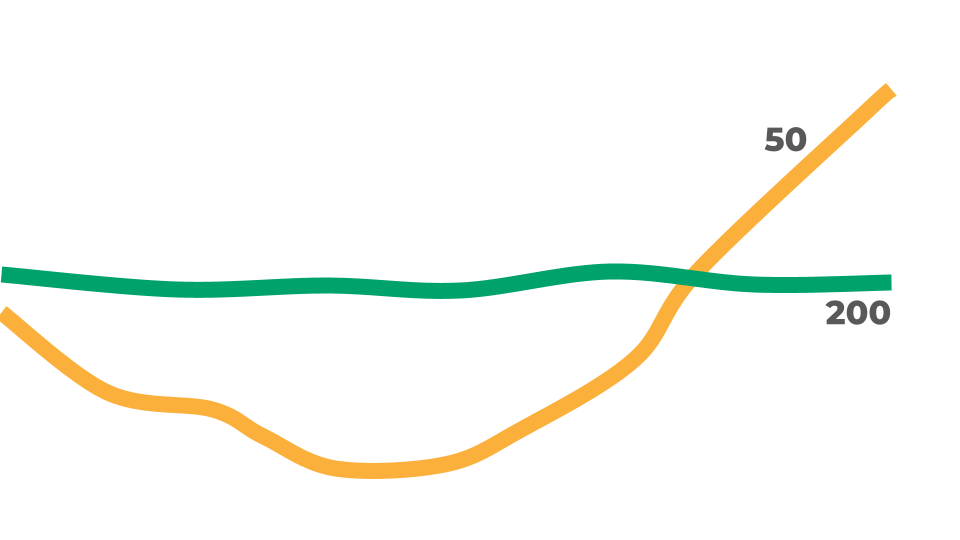
Scan Name: Golden CrossScan Type: Stock Indicator Scans
As of ---

Scan Name: Increasing Book ValueScan Type: Stock Fundamentals
As of ---

Scan Name: Uptrending StocksScan Type: Chart Pattern Scans
As of ---

Scan Name: Heikin Ashi BreakoutScan Type: Candlestick Pattern Scans
As of ---
Join Our Free Email List
Get emails from us about ways to potentially make money in the stock market.