Broadcom Inc
Stock Chart, Company Information, and Scan Results
$332.89(as of Feb 6, 3:59 PM EST)
Stock Market Guides is not a financial advisor. Our content is strictly educational and should not be considered financial advice.
Broadcom Inc Company Information, Fundamentals, and Technical Indicators
Stock Price$332.89
Ticker SymbolAVGO
ExchangeNasdaq
SectorTechnology
IndustrySemiconductors
Employees33,000
CountyUSA
Market Cap$1,472,212.9M
EBIDTA35,003.0M
10-Day Moving Average325.58
P/E Ratio70.38
20-Day Moving Average332.46
Forward P/E Ratio30.77
50-Day Moving Average351.09
Earnings per Share4.81
200-Day Moving Average308.24
Profit Margin47.28%
RSI49.36
Shares Outstanding4,741.3M
ATR15.80
52-Week High413.82
Volume32,964,195
52-Week Low137.28
Book Value81,292.0M
P/B Ratio20.02
Upper Keltner368.01
P/S Ratio25.48
Lower Keltner296.91
Debt-to-Equity Ratio368.01
Next Earnings Date03/04/2026
Cash Surplus-2,336.0M
Next Ex-Dividend DateUnknown
Broadcom’s roots run deep in the communication technology space. With Bell and AT&T as its predecessors, the company has a rich heritage in technology. As a semiconductor leader, AVGO develops, manufactures, and supplies a wide range of microchips and infrastructure software products globally. With a focus on innovation and strategic acquisitions, Broadcom could be positioning itself for long-term success.
Broadcom Inc In Our Stock Scanner
As of Feb 06, 2026
Scan Name: Increasing Profit MarginScan Type: Stock Fundamentals
As of ---

Scan Name: Increasing Book ValueScan Type: Stock Fundamentals
As of ---

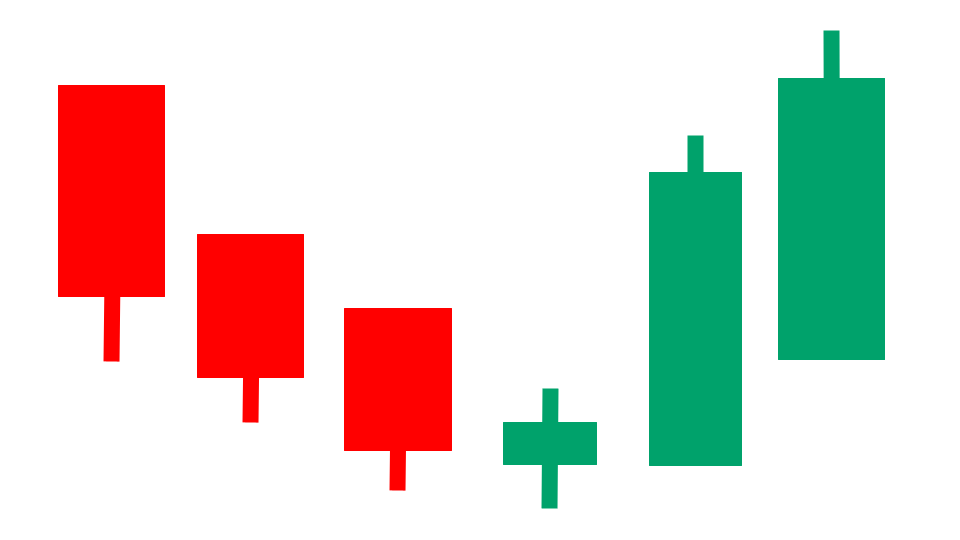
Scan Name: Heikin Ashi BreakoutScan Type: Candlestick Pattern Scans
As of ---
Join Our Free Email List
Get emails from us about ways to potentially make money in the stock market.