Amazon.com Inc
Stock Chart, Company Information, and Scan Results
$198.79(as of Feb 13, 4:00 PM EST)
Stock Market Guides is not a financial advisor. Our content is strictly educational and should not be considered financial advice.
Amazon.com Inc Company Information, Fundamentals, and Technical Indicators
Stock Price$198.79
Ticker SymbolAMZN
ExchangeNasdaq
SectorConsumer Cyclical
IndustryInternet Retail
Employees1,576,000
CountyUSA
Market Cap$2,133,994.8M
EBIDTA145,731.0M
10-Day Moving Average216.57
P/E Ratio27.80
20-Day Moving Average227.39
Forward P/E Ratio24.45
50-Day Moving Average230.46
Earnings per Share7.18
200-Day Moving Average223.62
Profit Margin9.93%
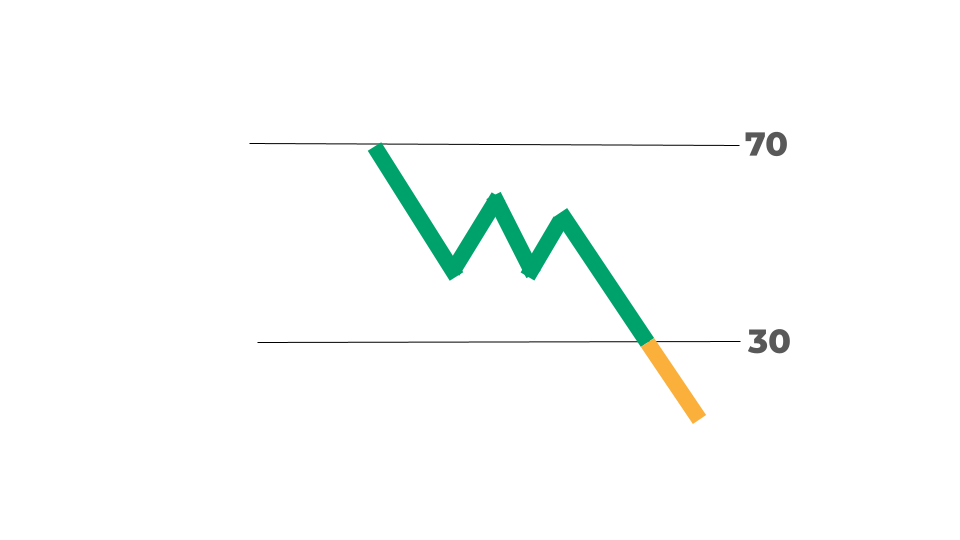
RSI23.10
Shares Outstanding10,734.9M
ATR7.27
52-Week High258.60
Volume66,321,593
52-Week Low161.38
Book Value411,065.0M
P/B Ratio5.25
Upper Keltner243.75
P/S Ratio3.01
Lower Keltner211.03
Debt-to-Equity Ratio243.75
Next Earnings Date04/29/2026
Cash Surplus-131,195.0M
Next Ex-Dividend DateUnknown
This online marketplace giant needs no introduction. Amazon is one of the most successful businesses of all time and one of the largest companies by market cap in the world with a valuation of over $1 trillion. But its services extend beyond the online marketplace. Offerings like Amazon Web Services are helping the company diversify into various areas and maintain continued growth.
Amazon.com Inc In Our Stock Scanner
As of Feb 17, 2026
Scan Name: Oversold Stocks Scan Type: Stock Indicator Scans
As of ---

Scan Name: Low Debt to Equity RatioScan Type: Stock Fundamentals
As of ---

Scan Name: Increasing Book ValueScan Type: Stock Fundamentals
As of ---
Join Our Free Email List
Get emails from us about ways to potentially make money in the stock market.