Wayfair Inc
Stock Chart, Company Information, and Scan Results
$92.62(as of Feb 6, 3:59 PM EST)
Stock Market Guides is not a financial advisor. Our content is strictly educational and should not be considered financial advice.
Wayfair Inc Company Information, Fundamentals, and Technical Indicators
Stock Price$92.62
Ticker SymbolW
ExchangeNyse
SectorConsumer Cyclical
IndustryInternet Retail
Employees12,100
CountyUSA
Market Cap$11,520.6M
EBIDTA4.0M
10-Day Moving Average102.20
P/E Ratio-37.04
20-Day Moving Average107.89
Forward P/E Ratio31.35
50-Day Moving Average104.47
Earnings per Share-2.57
Profit Margin-3.18%
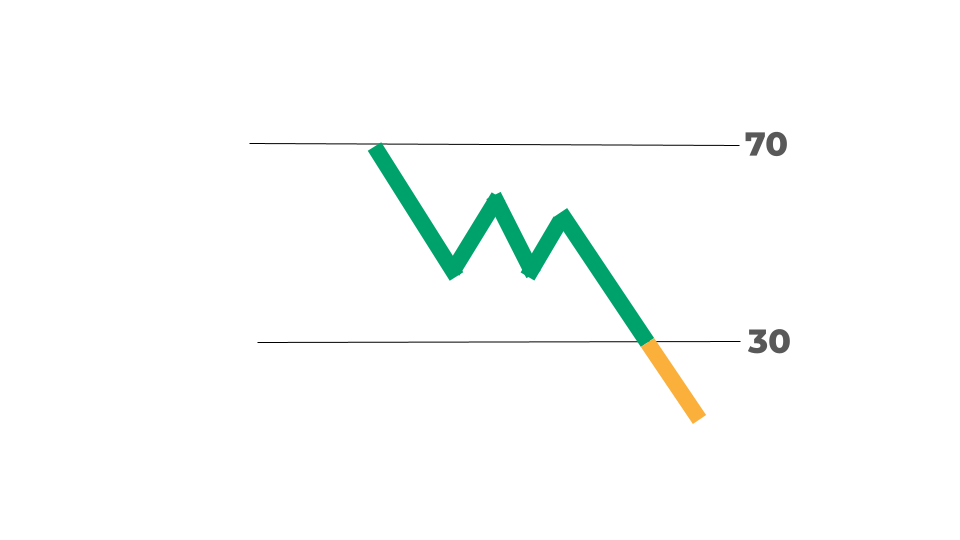
RSI35.20
Shares Outstanding106.9M
ATR6.16
52-Week High119.98
Volume3,715,948
52-Week Low20.41
Book Value-2,768.0M
P/B Ratio-4.35
Upper Keltner121.76
P/S Ratio0.98
Lower Keltner94.03
Debt-to-Equity Ratio121.76
Next Earnings Date02/19/2026
Cash Surplus-1,083.0M
Next Ex-Dividend DateUnknown
Wayfair has disrupted the furniture retail space by redefining how people purchase home goods. Its online sales business model has turned out to be both innovative and appealing in the industry. The eCommerce giant boasts a gigantic portfolio of more than 14 million items from over 11,000 global suppliers.
Wayfair Inc In Our Stock Scanner
As of Feb 06, 2026
Scan Name: Oversold Stocks Scan Type: Stock Indicator Scans
As of ---

Scan Name: Low PB RatioScan Type: Stock Fundamentals
As of ---

Scan Name: Low PS RatioScan Type: Stock Fundamentals
As of ---
Join Our Free Email List
Get emails from us about ways to potentially make money in the stock market.