Taboola
Stock Chart, Company Information, and Scan Results
$3.49(as of Oct 30, 11:15 AM EST)
Stock Market Guides is not a financial advisor. Our content is strictly educational and should not be considered financial advice.
Taboola Company Information, Fundamentals, and Technical Indicators
Stock Price$3.49
Ticker SymbolTBLA
ExchangeNasdaq
SectorCommunication Services
IndustryInternet Content & Information
Employees2,000
CountyUSA
Market Cap$1,053.4M
EBIDTA136.7M
P/E Ratio32.57
Forward P/E Ratio41.67
Earnings per Share0.04
Profit Margin-0.93%
RSI58.60
Shares Outstanding264.7M
ATR0.11
52-Week High4.30
Volume2,122,620
52-Week Low2.50
Book Value925.0M
P/B Ratio1.18
Upper Keltner3.50
P/S Ratio0.60
Lower Keltner3.01
Next Earnings Date11/05/2025
Cash Surplus-324.6M
Next Ex-Dividend DateUnknown
Taboola.com Ltd., together with its subsidiaries, operates an artificial intelligence-based algorithmic engine platform in Israel, the United States, the United Kingdom, Germany, and internationally. It offers Taboola, a platform that partners with websites, devices, and mobile apps to recommend editorial content and advertisements on the open web. The company was incorporated in 2006 and is headquartered in New York, New York.
Taboola In Our Stock Scanner
As of Oct 30, 2025
Scan Name: Undervalued StocksScan Type: Stock Fundamentals
As of ---

Scan Name: Low PS RatioScan Type: Stock Fundamentals
As of ---
Scan Name: Undervalued Blue ChipsScan Type: Stock Fundamentals
As of ---
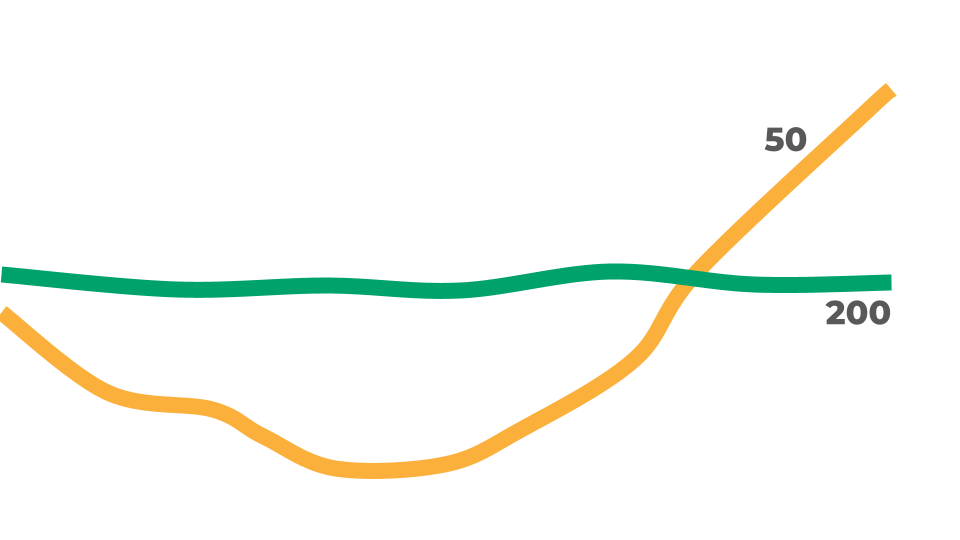
Scan Name: Golden CrossScan Type: Stock Indicator Scans
As of ---

Scan Name: Low Debt to Equity RatioScan Type: Stock Fundamentals
As of ---

Scan Name: Increasing Profit MarginScan Type: Stock Fundamentals
As of ---
Join Our Free Email List
Get emails from us about ways to potentially make money in the stock market.