Seabridge Gold Inc.
Stock Chart, Company Information, and Scan Results
$22.31(as of Nov 6, 3:59 PM EST)
Stock Market Guides is not a financial advisor. Our content is strictly educational and should not be considered financial advice.
Seabridge Gold Inc. Company Information, Fundamentals, and Technical Indicators
Stock Price$22.31
Ticker SymbolSA
ExchangeNyse
SectorBasic Materials
IndustryGold
EmployeesUnknown
CountyUSA
Market Cap$2,283.6M
EBIDTA-21.2M
P/E Ratio-49.67
Forward P/E Ratio0.00
Earnings per Share-0.39
Profit MarginInfinity%
RSI44.14
Shares Outstanding102.1M
ATR1.28
52-Week High29.31
Volume565,988
52-Week Low9.40
Book Value1,019.1M
P/B Ratio2.21
Upper Keltner27.26
P/S RatioInfinity
Lower Keltner21.49
Debt-to-Equity Ratio27.26
Next Earnings Date11/13/2025
Cash Surplus89.6M
Next Ex-Dividend DateUnknown
Seabridge Gold Inc., together with its subsidiaries, engages in the acquisition and exploration of gold properties in North America. It explores for gold, copper, silver, and molybdenum deposits. The company was formerly known as Seabridge Resources Inc. and changed its name to Seabridge Gold Inc. in June 2002. Seabridge Gold Inc. was incorporated in 1979 and is based in Toronto, Canada.
Seabridge Gold Inc. In Our Stock Scanner
As of Nov 07, 2025
Scan Name: Cash SurplusScan Type: Stock Fundamentals
As of ---

Scan Name: Low Debt to Equity RatioScan Type: Stock Fundamentals
As of ---

Scan Name: Increasing Book ValueScan Type: Stock Fundamentals
As of ---

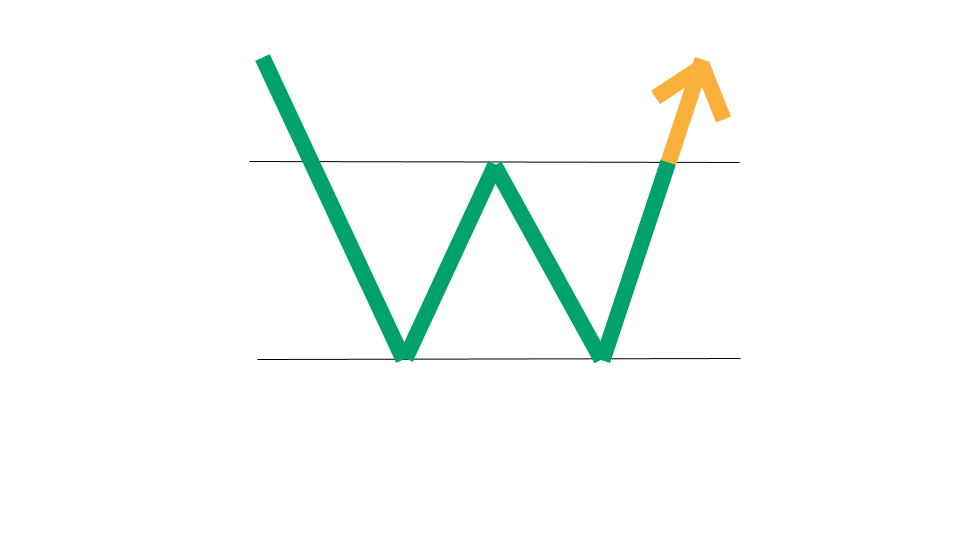
Scan Name: Double BottomScan Type: Chart Pattern Scans
As of ---
Join Our Free Email List
Get emails from us about ways to potentially make money in the stock market.