Reinsurance Group of America
Stock Chart, Company Information, and Scan Results
Stock Market Guides is not a financial advisor. Our content is strictly educational and should not be considered financial advice.
Reinsurance Group of America Company Information, Fundamentals, and Technical Indicators
Reinsurance Group of America, Incorporated provides reinsurance and financial solutions. It offers individual and group life and health insurance products, such as term life, credit life, universal life, whole life, group life and health, joint and last survivor insurance, critical illness, disability, and longevity products, as well as asset-intensive and financial reinsurance products; and other capital motivated solutions. The company also provides reinsurance for mortality, morbidity, lapse, and investment-related risk associated with products; and reinsurance for investment-related risks. In addition, the company develops and markets technology solutions; and offers consulting and outsourcing solutions for the insurance and reinsurance industries. It operates in the United States, Latin America, Canada, Europe, the Middle East, Africa, and the Asia Pacific. Reinsurance Group of America, Incorporated was founded in 1973 and is headquartered in Chesterfield, Missouri.
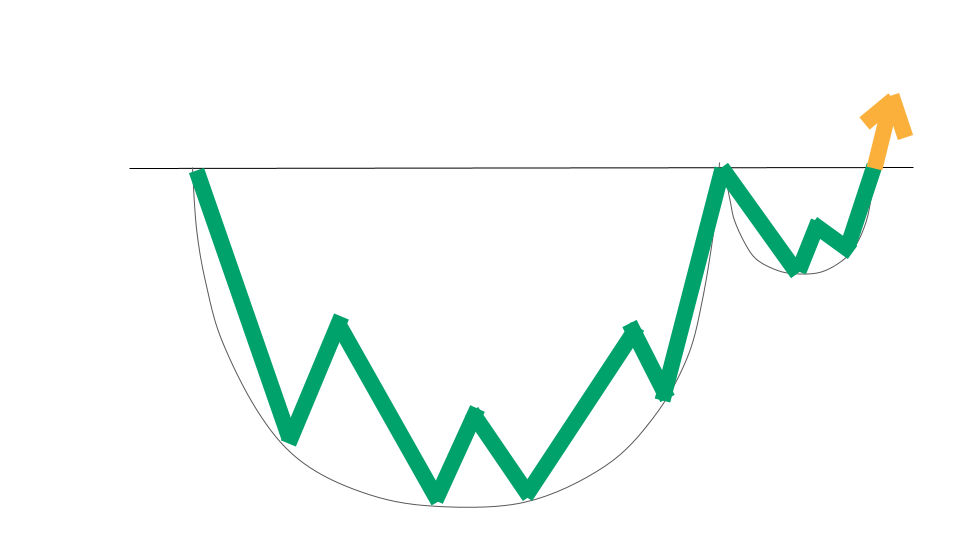
Reinsurance Group of America In Our Stock Scanner
As of Nov 17, 2025


Join Our Free Email List
Get emails from us about ways to potentially make money in the stock market.