Novo Nordisk A/S
Stock Chart, Company Information, and Scan Results
Stock Market Guides is not a financial advisor. Our content is strictly educational and should not be considered financial advice.
Novo Nordisk A/S Company Information, Fundamentals, and Technical Indicators
Novo Nordisk A/S, together with its subsidiaries, engages in the research and development, manufacture, and distribution of pharmaceutical products. It operates through two segments, Obesity and Diabetes Care, and Rare Disease. The Obesity and Diabetes care segment provides products for diabetes, obesity, cardiovascular, and other emerging therapy areas. The Rare Disease segment offers products in the areas of rare blood disorders, rare endocrine disorders, and hormone replacement therapy. The company also provides NovoPen 6 and NovoPen Echo Plus, smart insulin pens; Dose Check, an insulin dose guidance application; growth hormone pens and injection needles; and Wegovy pill an oral glucagon-like peptide-1 (GLP-1) receptor agonist therapy for weight management. The company has a collaboration with Anthropic accelerate the development of new medicines and advance AI-driven software development. It operates in Europe, Canada, the United States, Japan, Korea, Oceania, Southeast Asia, Mainland China, Hong Kong and Taiwan, Latin America, the Middle East, and Africa. It has a strategic collaboration with Orbis Medicines to discover and develop oral macrocycle therapeutics for cardiometabolic diseases. The company was formerly known as Novo Industri A/S and changed its name to Novo Nordisk A/S in April 1989. The company was founded in 1923 and is headquartered in Bagsvaerd, Denmark.
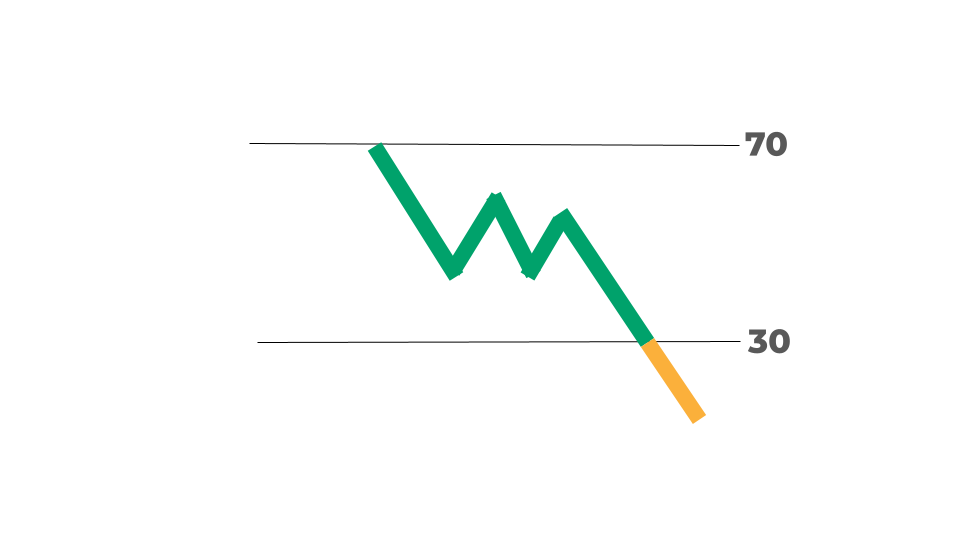
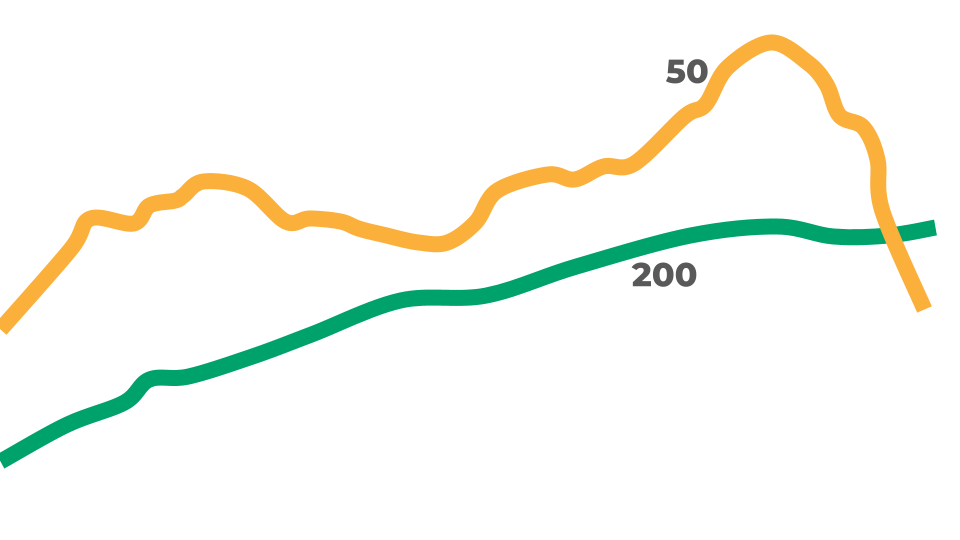
Novo Nordisk A/S In Our Stock Scanner
As of Oct 04, 2026
Join Our Free Email List
Get emails from us about ways to potentially make money in the stock market.