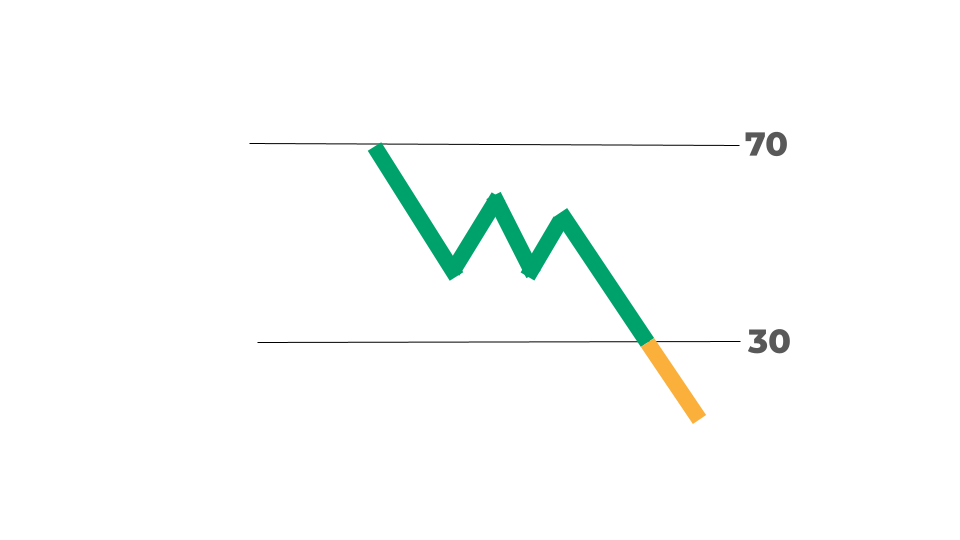
Linde plc Ordinary Shares
Stock Chart, Company Information, and Scan Results
Stock Market Guides is not a financial advisor. Our content is strictly educational and should not be considered financial advice.
Linde plc Ordinary Shares Company Information, Fundamentals, and Technical Indicators
Linde plc operates as an industrial gas company in the United States, China, Germany, the United Kingdom, Australia, Mexico, Brazil, and internationally. It offers atmospheric gases, including oxygen, nitrogen, argon, and rare gases; and process gases, such as hydrogen, helium, carbon dioxide, carbon monoxide, electronic gases, specialty gases, acetylene, etc. The company also designs and constructs turnkey process plants for third-party customers, as well as for the gas businesses in various locations consist of air separation, hydrogen, synthesis, olefin, and natural gas plants. It serves a range of industries comprising healthcare, chemicals and energy, manufacturing, metals and mining, food and beverage, and electronics. Linde plc was founded in 1879 and is based in Woking, the United Kingdom.
Linde plc Ordinary Shares In Our Stock Scanner
As of Oct 30, 2025


Join Our Free Email List
Get emails from us about ways to potentially make money in the stock market.