JBS N.V.
Stock Chart, Company Information, and Scan Results
$13.59(as of Oct 6, 3:59 PM EST)
Stock Market Guides is not a financial advisor. Our content is strictly educational and should not be considered financial advice.
JBS N.V. Company Information, Fundamentals, and Technical Indicators
Stock Price$13.59
Ticker SymbolJBS
ExchangeNyse
SectorConsumer Defensive
IndustryPackaged Foods
Employees280,000
CountyUSA
Market Cap$15,227.4M
EBIDTAUnknown
P/E Ratio2.46
Forward P/E Ratio0.00
Earnings per ShareUnknown
Profit Margin2.55%
RSI26.78
Shares Outstanding1,109.0M
ATR0.37
52-Week High17.80
Volume17,503,572
52-Week Low12.83
Book Value50,388.9M
P/B Ratio0.60
Upper Keltner15.99
P/S Ratio0.07
Lower Keltner14.33
Debt-to-Equity Ratio15.99
Next Earnings Date11/13/2025
Cash Surplus-42,800.1M
Next Ex-Dividend DateUnknown
JBS N.V., together with its subsidiaries, operates as a protein and food company worldwide. The company offers beef, poultry, pork, plant-based, and leather products, as well as engages in related-business, and swift services. The company was founded in 1953 and is based in Sao Paulo, Brazil.
JBS N.V. In Our Stock Scanner
As of Oct 07, 2025
Scan Name: Unusual VolumeScan Type: Stock Indicator Scans
As of ---
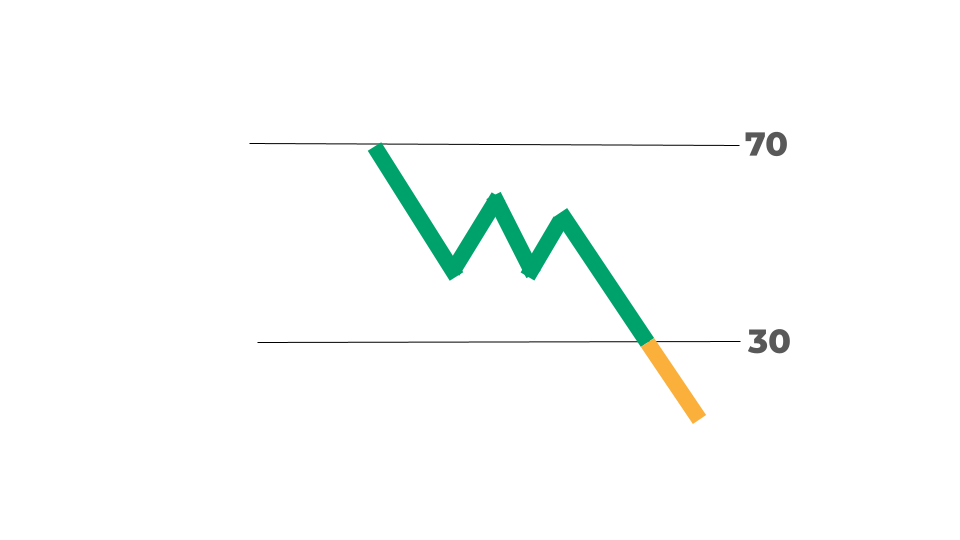
Scan Name: Oversold Stocks Scan Type: Stock Indicator Scans
As of ---

Scan Name: Low PS RatioScan Type: Stock Fundamentals
As of ---
Join Our Free Email List
Get emails from us about ways to potentially make money in the stock market.