Gilead Sciences Inc
Stock Chart, Company Information, and Scan Results
$142.83(as of Feb 2, 3:59 PM EST)
Stock Market Guides is not a financial advisor. Our content is strictly educational and should not be considered financial advice.
Gilead Sciences Inc Company Information, Fundamentals, and Technical Indicators
Stock Price$142.83
Ticker SymbolGILD
ExchangeNasdaq
SectorHealthcare
IndustryDrug Manufacturers - General
Employees17,600
CountyUSA
Market Cap$176,132.5M
EBIDTA14,136.0M
10-Day Moving Average134.52
P/E Ratio21.95
20-Day Moving Average128.11
Forward P/E Ratio15.87
50-Day Moving Average125.18
Earnings per Share6.57
200-Day Moving Average114.55
Profit Margin39.28%
RSI73.60
Shares Outstanding1,240.7M
ATR3.54
52-Week High142.20
Volume9,460,236
52-Week Low91.47
Book Value21,456.0M
P/B Ratio8.30
Upper Keltner136.09
P/S Ratio6.12
Lower Keltner120.14
Debt-to-Equity Ratio136.09
Next Earnings Date02/10/2026
Cash Surplus-4,967.0M
Next Ex-Dividend DateUnknown
Add good karma to your portfolio with GILD. This research-based biopharmaceutical company is making the world a better place by developing and commercializing medicines for life-threatening diseases like HIV/AIDS, liver diseases, and cancer. Gilead’s HIV treatments, including Truvada and Atripla, have helped transform the chronic disease into a manageable condition. Their treatments are responsible for saving millions of lives.
Gilead Sciences Inc In Our Stock Scanner
As of Feb 02, 2026
Scan Name: Increasing Book ValueScan Type: Stock Fundamentals
As of ---

Scan Name: Uptrending StocksScan Type: Chart Pattern Scans
As of ---

Scan Name: Increasing Profit MarginScan Type: Stock Fundamentals
As of ---

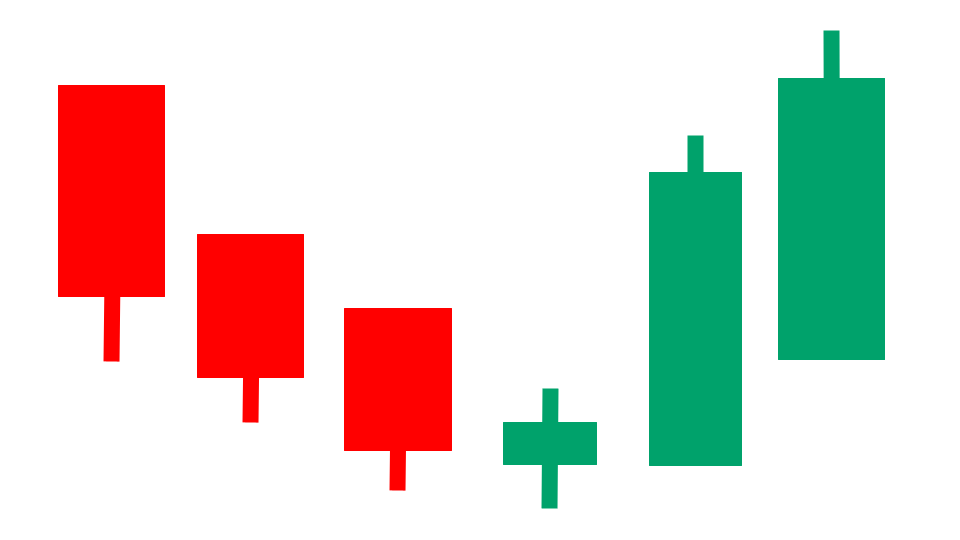
Scan Name: Heikin Ashi BreakoutScan Type: Candlestick Pattern Scans
As of ---

Scan Name: 52-Week HighScan Type: Stock Fundamentals
As of ---
Join Our Free Email List
Get emails from us about ways to potentially make money in the stock market.