Ehang Holdings Ltd
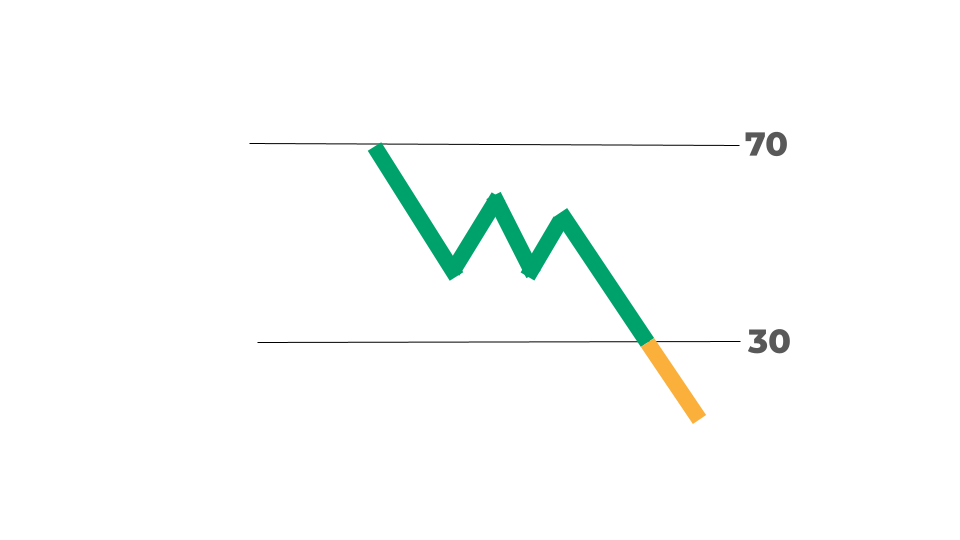
Stock Chart, Company Information, and Scan Results
Stock Market Guides is not a financial advisor. Our content is strictly educational and should not be considered financial advice.
Ehang Holdings Ltd Company Information, Fundamentals, and Technical Indicators
EHang Holdings Limited operates as an urban air mobility (UAM) technology platform company in the People's Republic of China, East Asia, West Asia, North America, South America, West Africa, and Europe. It designs, develops, manufactures, sells, and operates UAVs, as well as supporting systems and infrastructure for various industries and applications, including passenger transportation, logistics, smart city management, and aerial media solutions. The company's product portfolio includes EH216 series, the VT series, the Falcon B, and the GD series. It also offers airborne operating systems, including autopilot and flight control, communication, battery management system, and safety management systems; and command-and-control system. In addition, the company has built a digital UAM operational platform architecture and visualized flight operation module for managing the EH216-S flight schedule, ground crew, vertiports and landing pads, and other factors for the entire front-line UAM operational process. Further, it offers vertiports for eVTOL aircraft operations and mobility efficiency; and charging piles for eVTOL aircraft. Additionally, the company provides air mobility solutions; smart city management, which centralizes and coordinates a range of UAV applications; and aerial media solutions for drone light shows. EHang Holdings Limited was incorporated in 2014 and is headquartered in Guangzhou, the People's Republic of China.
Ehang Holdings Ltd In Our Stock Scanner
As of Nov 26, 2025


Join Our Free Email List
Get emails from us about ways to potentially make money in the stock market.