BlackRock Inc
Stock Chart, Company Information, and Scan Results
$1,059.91(as of Nov 4, 3:59 PM EST)
Stock Market Guides is not a financial advisor. Our content is strictly educational and should not be considered financial advice.
BlackRock Inc Company Information, Fundamentals, and Technical Indicators
Stock Price$1,059.91
Ticker SymbolBLK
ExchangeNyse
SectorFinancial Services
IndustryAsset Management
Employees21,100
CountyUSA
Market Cap$165,775.5M
EBIDTA8,717.0M
10-Day Moving Average1,105.52
P/E Ratio27.23
20-Day Moving Average1,134.72
Forward P/E Ratio22.03
50-Day Moving Average1,133.49
Earnings per Share38.80
200-Day Moving Average1,025.98
Profit Margin20.33%
RSI29.67
Shares Outstanding155.1M
ATR23.41
52-Week High1,219.94
Volume934,580
52-Week Low766.05
Most Recent Support Level1,119.99
Book Value0.0M
Most Recent Resistance Level1,146.39
P/B RatioInfinity
Upper Keltner1,187.39
P/S Ratio7.25
Lower Keltner1,082.06
Debt-to-Equity Ratio1,187.39
Next Earnings Date01/14/2026
Cash Surplus0.0M
Next Ex-Dividend DateUnknown
BlackRock has become an undisputable leader in the investment industry. The world's largest asset manager calls bragging rights to a nearly $10 trillion portfolio. The institution also played a critical role in the Fed’s bond-buying spree and is known to be a trendsetter in the market. If BlackRock is good enough for the Fed, do you think it could be good enough for you?
BlackRock Inc In Our Stock Scanner
As of Nov 05, 2025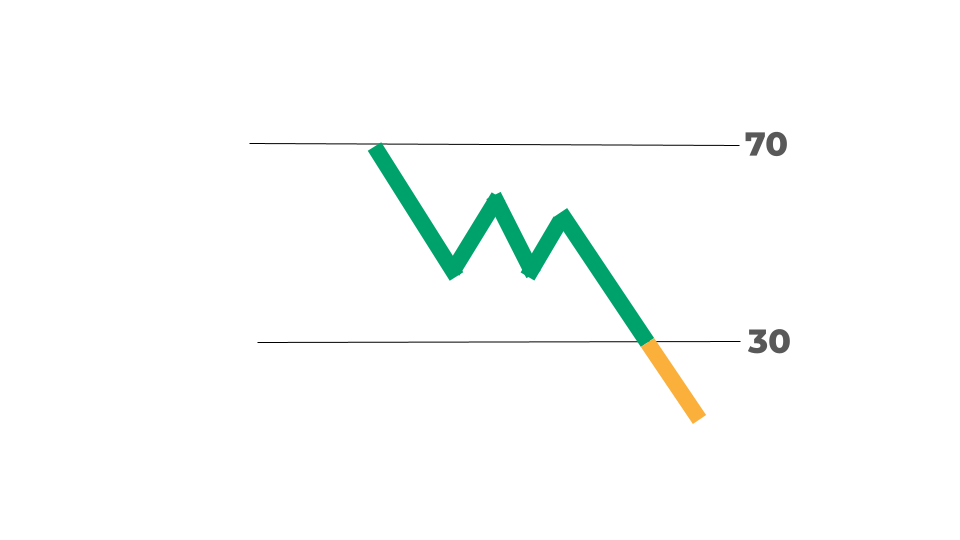
Scan Name: Oversold Stocks Scan Type: Stock Indicator Scans
As of ---
Join Our Free Email List
Get emails from us about ways to potentially make money in the stock market.