Brookfield Asset Management Inc
Stock Chart, Company Information, and Scan Results
$49.73(as of Feb 6, 3:59 PM EST)
Stock Market Guides is not a financial advisor. Our content is strictly educational and should not be considered financial advice.
Brookfield Asset Management Inc Company Information, Fundamentals, and Technical Indicators
Stock Price$49.73
Ticker SymbolBAM
ExchangeNyse
SectorFinancial Services
IndustryAsset Management
Employees2,500
CountyUSA
Market Cap$78,536.5M
EBIDTA2,776.0M
P/E Ratio31.01
Forward P/E Ratio25.51
Earnings per Share1.52
Profit Margin57.83%
RSI43.98
Shares Outstanding1,612.4M
ATR1.63
52-Week High63.10
Volume4,187,445
52-Week Low40.81
Book Value10,674.0M
P/B Ratio7.57
Upper Keltner54.79
P/S Ratio18.06
Lower Keltner47.48
Debt-to-Equity Ratio54.79
Next Earnings DateUnknown
Cash Surplus-1,921.0M
Next Ex-Dividend Date02/27/2026
Brookfield is yet another alternative asset leader with more than $800 billion in assets under management. This financial titan spreads its risk across renewable power, infrastructure, private equity, real estate, and credit. Investors might find compelling opportunities in leveraging BAM’s highly diversified assets into their portfolios.
Brookfield Asset Management Inc In Our Stock Scanner
As of Feb 06, 2026
Scan Name: Increasing Profit MarginScan Type: Stock Fundamentals
As of ---

Scan Name: Low Debt to Equity RatioScan Type: Stock Fundamentals
As of ---

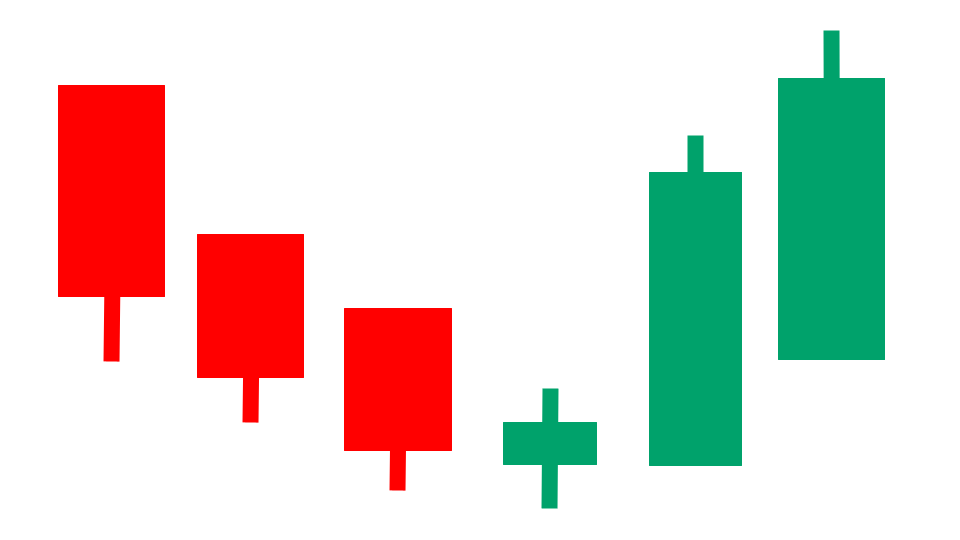
Scan Name: Heikin Ashi BreakoutScan Type: Candlestick Pattern Scans
As of ---
Join Our Free Email List
Get emails from us about ways to potentially make money in the stock market.