Alnylam Pharmaceuticals Inc
Stock Chart, Company Information, and Scan Results
$320.17(as of Feb 11, 12:52 PM EST)
Stock Market Guides is not a financial advisor. Our content is strictly educational and should not be considered financial advice.
Alnylam Pharmaceuticals Inc Company Information, Fundamentals, and Technical Indicators
Stock Price$320.17
Ticker SymbolALNY
ExchangeNasdaq
SectorHealthcare
IndustryBiotechnology
Employees2,230
CountyUSA
Market Cap$42,276.4M
EBIDTA321.0M
10-Day Moving Average337.97
P/E Ratio1,018.26
20-Day Moving Average350.01
Forward P/E Ratio43.86
50-Day Moving Average387.91
Earnings per Share0.29
200-Day Moving Average386.31
Profit Margin20.10%
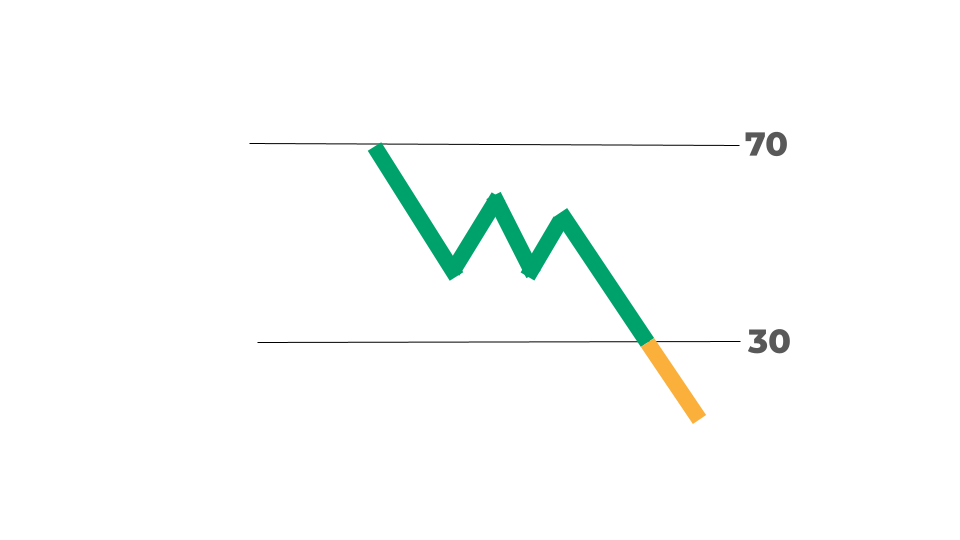
RSI29.61
Shares Outstanding132.1M
ATR13.35
52-Week High495.55
Volume1,865,594
52-Week Low205.87
Book Value233.9M
P/B Ratio189.66
Upper Keltner380.04
P/S Ratio13.82
Lower Keltner319.97
Debt-to-Equity Ratio380.04
Next Earnings Date02/12/2026
Cash Surplus-65.2M
Next Ex-Dividend DateUnknown
This innovative biotech stock has helped transform RNAi into an innovative new class of medicine. You have probably heard about RNA and mRNA innovation as the basis for the COVID-19 vaccine. This novel technology is set to shake up the medical world, and Alnylam is well-positioned to benefit from it.
Alnylam Pharmaceuticals Inc In Our Stock Scanner
As of Feb 11, 2026
Scan Name: Oversold Stocks Scan Type: Stock Indicator Scans
As of ---

Scan Name: Increasing Profit MarginScan Type: Stock Fundamentals
As of ---
Join Our Free Email List
Get emails from us about ways to potentially make money in the stock market.