Free Stock Fundamentals Scanner
Stock Market Guides is not a financial advisor. Our content is strictly educational and should not be considered financial advice.
This is a free scanner that finds stocks meeting popular criteria for stock fundamentals.
| TICKER | YESTERDAY'S LAST PRICE | ENTER UP TO | CHART | TRADE STRATEGY | WINS* | LOSSES* | WIN %* | ANNUALIZED RETURN | TRADE DURATION | VOLUME | MARKET CAP | SECTOR | EARNINGS OVERLAP | DIVIDEND OVERLAP | TIME ADDED |
|---|---|---|---|---|---|---|---|---|---|---|---|---|---|---|---|
$196.51 | $198.73 | Has a Low Debt Equity Ratio | IZOO IO ZO.OZ% I3OO.OI% | 3 months | 153,410,785 | $5,009,871.7M | Technology | Yes | No | 07/28/2026 9:30 AM EST | |||||
$196.51 | $198.73 | Has Increasing Book Value | IZOO IO ZO.OZ% I3OO.OI% | 3 months | 153,410,785 | $5,009,871.7M | Technology | Yes | No | 07/28/2026 9:30 AM EST | |||||
$196.51 | $198.73 | Is 10-20% Below its 1-Year High | IZOO IO ZO.OZ% I3OO.OI% | 3 months | 153,410,785 | $5,009,871.7M | Technology | Yes | No | 07/28/2026 9:30 AM EST | |||||
$196.51 | $198.73 | Has Increasing Profit Margin | IZOO IO ZO.OZ% I3OO.OI% | 3 months | 153,410,785 | $5,009,871.7M | Technology | Yes | No | 07/28/2026 9:30 AM EST | |||||
$336.91 | $344.10 | Has Increasing Book Value | IZOO IO ZO.OZ% I3OO.OI% | 3 months | 45,246,885 | $4,891,182.9M | Technology | Yes | No | 07/28/2026 9:30 AM EST | |||||
$336.91 | $344.10 | At 52-Week High | IZOO IO ZO.OZ% I3OO.OI% | 3 months | 45,246,885 | $4,891,182.9M | Technology | Yes | No | 07/28/2026 9:30 AM EST | |||||
$326.56 | $333.89 | Is 10-20% Below its 1-Year High | IZOO IO ZO.OZ% I3OO.OI% | 3 months | 27,890,062 | $3,910,399.4M | Communication Services | No | Yes | 07/28/2026 9:30 AM EST | |||||
$326.57 | $333.66 | Is 10-20% Below its 1-Year High | IZOO IO ZO.OZ% I3OO.OI% | 3 months | 20,341,422 | $3,902,449.9M | Communication Services | No | Yes | 07/28/2026 9:30 AM EST | |||||
$389.10 | $399.16 | Has a Low Debt Equity Ratio | IZOO IO ZO.OZ% I3OO.OI% | 3 months | 27,266,319 | $2,835,433.7M | Technology | Yes | Yes | 07/28/2026 9:30 AM EST | |||||
$389.10 | $399.16 | Has Increasing Book Value | IZOO IO ZO.OZ% I3OO.OI% | 3 months | 27,266,319 | $2,835,433.7M | Technology | Yes | Yes | 07/28/2026 9:30 AM EST | |||||
*According to our backtests
How to Use Our Free Stock Fundamentals Scanner
The above list represents stocks that meet popular stock fundamental criteria today.
It's powered by our proprietary stock scanner, which searches once per day for stocks that meet these fundamental criteria.
You can sort columns using the up and down arrows next to the column name. You can add filters for the column values by clicking the "Add Filter" button above the list of stocks. This scanner is designed for active stock traders.
This video shows how to use our scanner:
Scanner Features that Require a Subscription
Our free scanner offers you the ability to find stocks that meet popular stock fundamental criteria , but you may need more than that to ensure you're making trades that have a true edge.
Our paid Stock Investing Service includes scanner features that are designed to offer you all the intelligence our research can offer. These are the scanner features you get if you pay for a subscription:
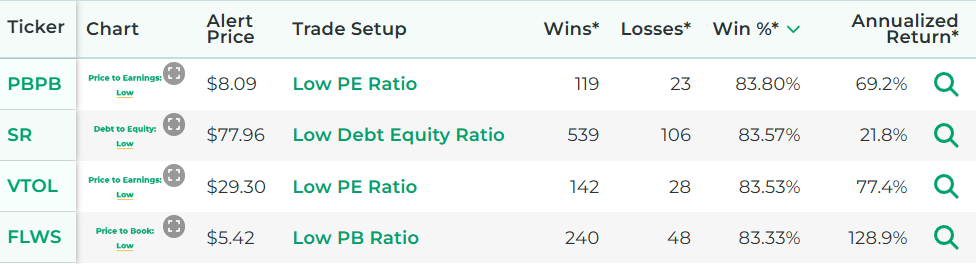
- See the historical backtested performance for each scan result. It looks like this:
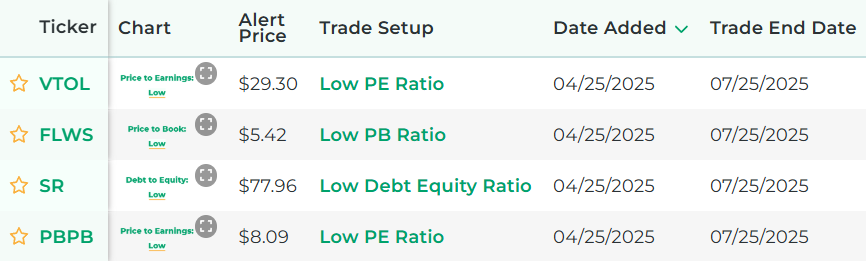
- See full trade setups for each scan result, including when to enter and exit. It looks like this:
- Get alerted when there are new scan results (by text or email).
- Get access to real-time scan updates throughout the trading day.
- Access scan results for all trading strategies in a single scan to easily see which trade setups have the best backtested performance across the entire market at any given time.
- Get access to scan results for our proprietary trading strategies, which required years of research to develop.
- Find Stock Investment Ideas That Have a Backtested Edge
- Has DIY Stock Investing Scanner
- Get Stock Picks from Our Scanner: 43.1% Average Annualized Return in Backtests
Here's a video that explains the difference between our free stock fundamental scanner and the scanner from our paid service:
Stock Market Guides
Stock Market Guides identifies stock investing opportunities that have a historical track record of profitability in backtests.
Average Annualized Return?
43.1%
Which Stock Fundamentals Are Included In Our Scanner?
The follow popular stock fundamentals are ones that are included in the above scanner:
52-Week High
There are 52 weeks in a year, and a stock’s 52-week high provides a point of reference about the price range of a stock over the last year.
As you look at the price activity of any stock, it can be helpful to see its range of price at any given time. It helps you understand how a stock’s current price relates to its performance over the last year.
52-Week Low
There are 52 weeks in a year, and a stock’s 52-week low provides a point of reference about the price range of a stock over the last year.
As you look at the price activity of any stock, it can be helpful to see its range of price at any given time. It helps you understand how a stock’s current price relates to its performance over the last year.
Book Value
Book value in the stock market is a type of fundamental metric that refers to a specific measure of a company's worth.
A company's book value can be found on its balance sheet by subtracting the company's Total Assets from its Total Liabilities. That simple formula gives the book value of a company, which is also referred to as shareholder equity.
It can be helpful for stock market investors to look at a company's book value per share, which simply takes the company's book value and divides it by the company's total outstanding shares. The company's outstanding shares can also be found on its balance sheet.
Cash Surplus
A cash surplus is a fundamental metric that refers to a company's cash position.
Each company in the stock market has some amount of cash on hand, as indicated on the company's balance sheet. It refers to the company's most liquid asset, meaning it's the asset most easily convertible to currency that can be used for immediate spending.
Put more simply, cash represents money in the bank.
When referring to a company's cash position, they can be said to have a cash surplus if they have more cash on hand than short-term liabilities.
A company's short-term liabilities, also visible on its balance sheet, refer to debts or obligations that are due within one year.
If a company has more cash than it has short-term liabilities, then it has a surplus of cash. It has more cash than it needs to service its financial obligations that will be due in the short term.
Debt-to-Equity Ratio
A debt-to-equity ratio is a fundamental valuation metric used in the stock market to evaluate a company's financial health.
It looks at how much debt a company has in relation to its equity. It can be a helpful measure of the financial risk a company faces.
The formula looks like this:
Debt-to-Equity Ratio = (Total Liabilities) / (Shareholder Equity)
Here is a breakdown of the components of the calculation:
Total Liabilities: This includes both short-term and long-term debt obligations of the company.
Shareholder Equity: This is essentially the net worth of the company, calculated as total assets minus total liabilities. This is also referred to as the book value of the company.
The company's total liabilities and shareholder equity can be found on its balance sheet, which is publicly available for companies in the stock market.
PB Ratio
PB ratio (or P/B ratio) stands for Price-to-Book ratio. It's a fundamental valuation metric used in the stock market to evaluate a company's stock price relative to its book value.
It’s calculated by taking the current share price of a company's stock and dividing it by its book value per share.
The formula looks like this:
PB Ratio = (Current Share Price) / (Book Value per Share)
Here is a breakdown of the components of the calculation:
Current Share Price: This is simply the current price of the company’s stock at any given moment.
Book Value Per Share: This takes the book value of the company over the last 12 months (as of the company's most recent quarterly financial report), and divides it by the total shares outstanding for the company.
The company's book value can be found on its balance sheet by subtracting the company's Total Assets from its Total Liabilities. The company's outstanding shares can also be found on its balance sheet.
PE Ratio
PE ratio (or P/E ratio) stands for Price-to-Earnings ratio. It's a fundamental valuation metric used in the stock market to evaluate a company's stock price relative to its earnings.
It’s calculated by taking the current share price of a company's stock and dividing it by its earnings per share (EPS).
The formula looks like this:
PE Ratio = (Current Share Price) / (Earnings per Share)
Here is a breakdown of the components of the calculation:
Current Share Price: This is simply the current price of the company’s stock at any given moment.
Earnings Per Share (EPS): This takes the earnings of the company over the last 12 months (as of the company's most recent quarterly financial report), and divides it by the total shares outstanding for the company. The company's earnings can be found on its income statement, and the company's outstanding shares can be found on its balance sheet.
The calculation above is the classic way to compute a company's PE ratio. It's also referred to as a trailing PE ratio since it's looking at historical earnings (actual earnings).
Companies also project earnings, and there is a metric called a forward PE ratio that uses projected earnings as the basis for the calculation.
Profit Margin
Profit margin is a fundamental metric that refers to a key measure of profitability for companies.
It essentially tells you how much profit a company makes for every dollar of sales it generates.
Here is the formula for calculating profit margin:
Profit Margin = Net Income / Revenues
Profit Margin = Net Income / Revenues
Net Income is the profit of the company after all costs and expenses have been subtracted from revenues. It is also sometimes referred to as "Net Earnings" or "Net Profit".
Revenues refer to the total sales of the company before costs and expenses are deducted. This is sometimes also referred to as Gross Income.
The profit margin value will be displayed as a percentage.
There is another metric called gross profit margin that takes the gross profit of a company and divides it by the company's total revenues. The gross profit is equal to the company's revenues minus its cost of goods sold, which, in other words, is the company's profit before accounting for overhead costs.
PS Ratio
PS ratio (or P/S ratio) stands for Price-to-Sales ratio. It's a fundamental valuation metric used in the stock market to evaluate a company's stock price relative to its sales.
It’s calculated by taking the current share price of a company's stock and dividing it by its sales per share.
The formula looks like this:
PS Ratio = (Current Share Price) / (Sales per Share)
Here is a breakdown of the components of the calculation:
Current Share Price: This is simply the current price of the company’s stock at any given moment.
Sales Per Share: This takes the sales of the company over the last 12 months (as of the company's most recent quarterly financial report), and divides it by the total shares outstanding for the company. The company's sales (also known as revenues) can be found on its income statement, and the company's outstanding shares can be found on its balance sheet.
The calculation above is the classic way to compute a company's PS ratio. It's also referred to as a trailing PS ratio since it's looking at historical sales (actual sales).
Companies also project sales, and there is a metric called a forward PS ratio that uses projected sales as the basis for the calculation.
How We Find Important Stock Fundamentals Each Day
Our one-of-a-kind scanning technology is at the heart of everything we do here. We have a way to define popular stock fundamental values in our scanner, and then it uses real-time data feeds to find any stocks that meet those criteria.
Learn More at Stock Market Guides
Want to learn other popular indicators, chart patterns, and candlestick patterns? Check them out here:


Have Questions About Stock Fundamentals or About Our Services?
If you have questions about stock fundamentals or questions about any services we offer, you can contact us any time and we'll be ready to help.
Join Our Free Email List
Get emails from us about ways to potentially make money in the stock market.
Stock Market Guides
You can trade without an edge, but why?
What We Offer
Stock Market Guides identifies stock investing opportunities that have a historical track record of profitability in backtests.
Average Annualized Return?
43.1%